A good plot brings a jolt of understanding
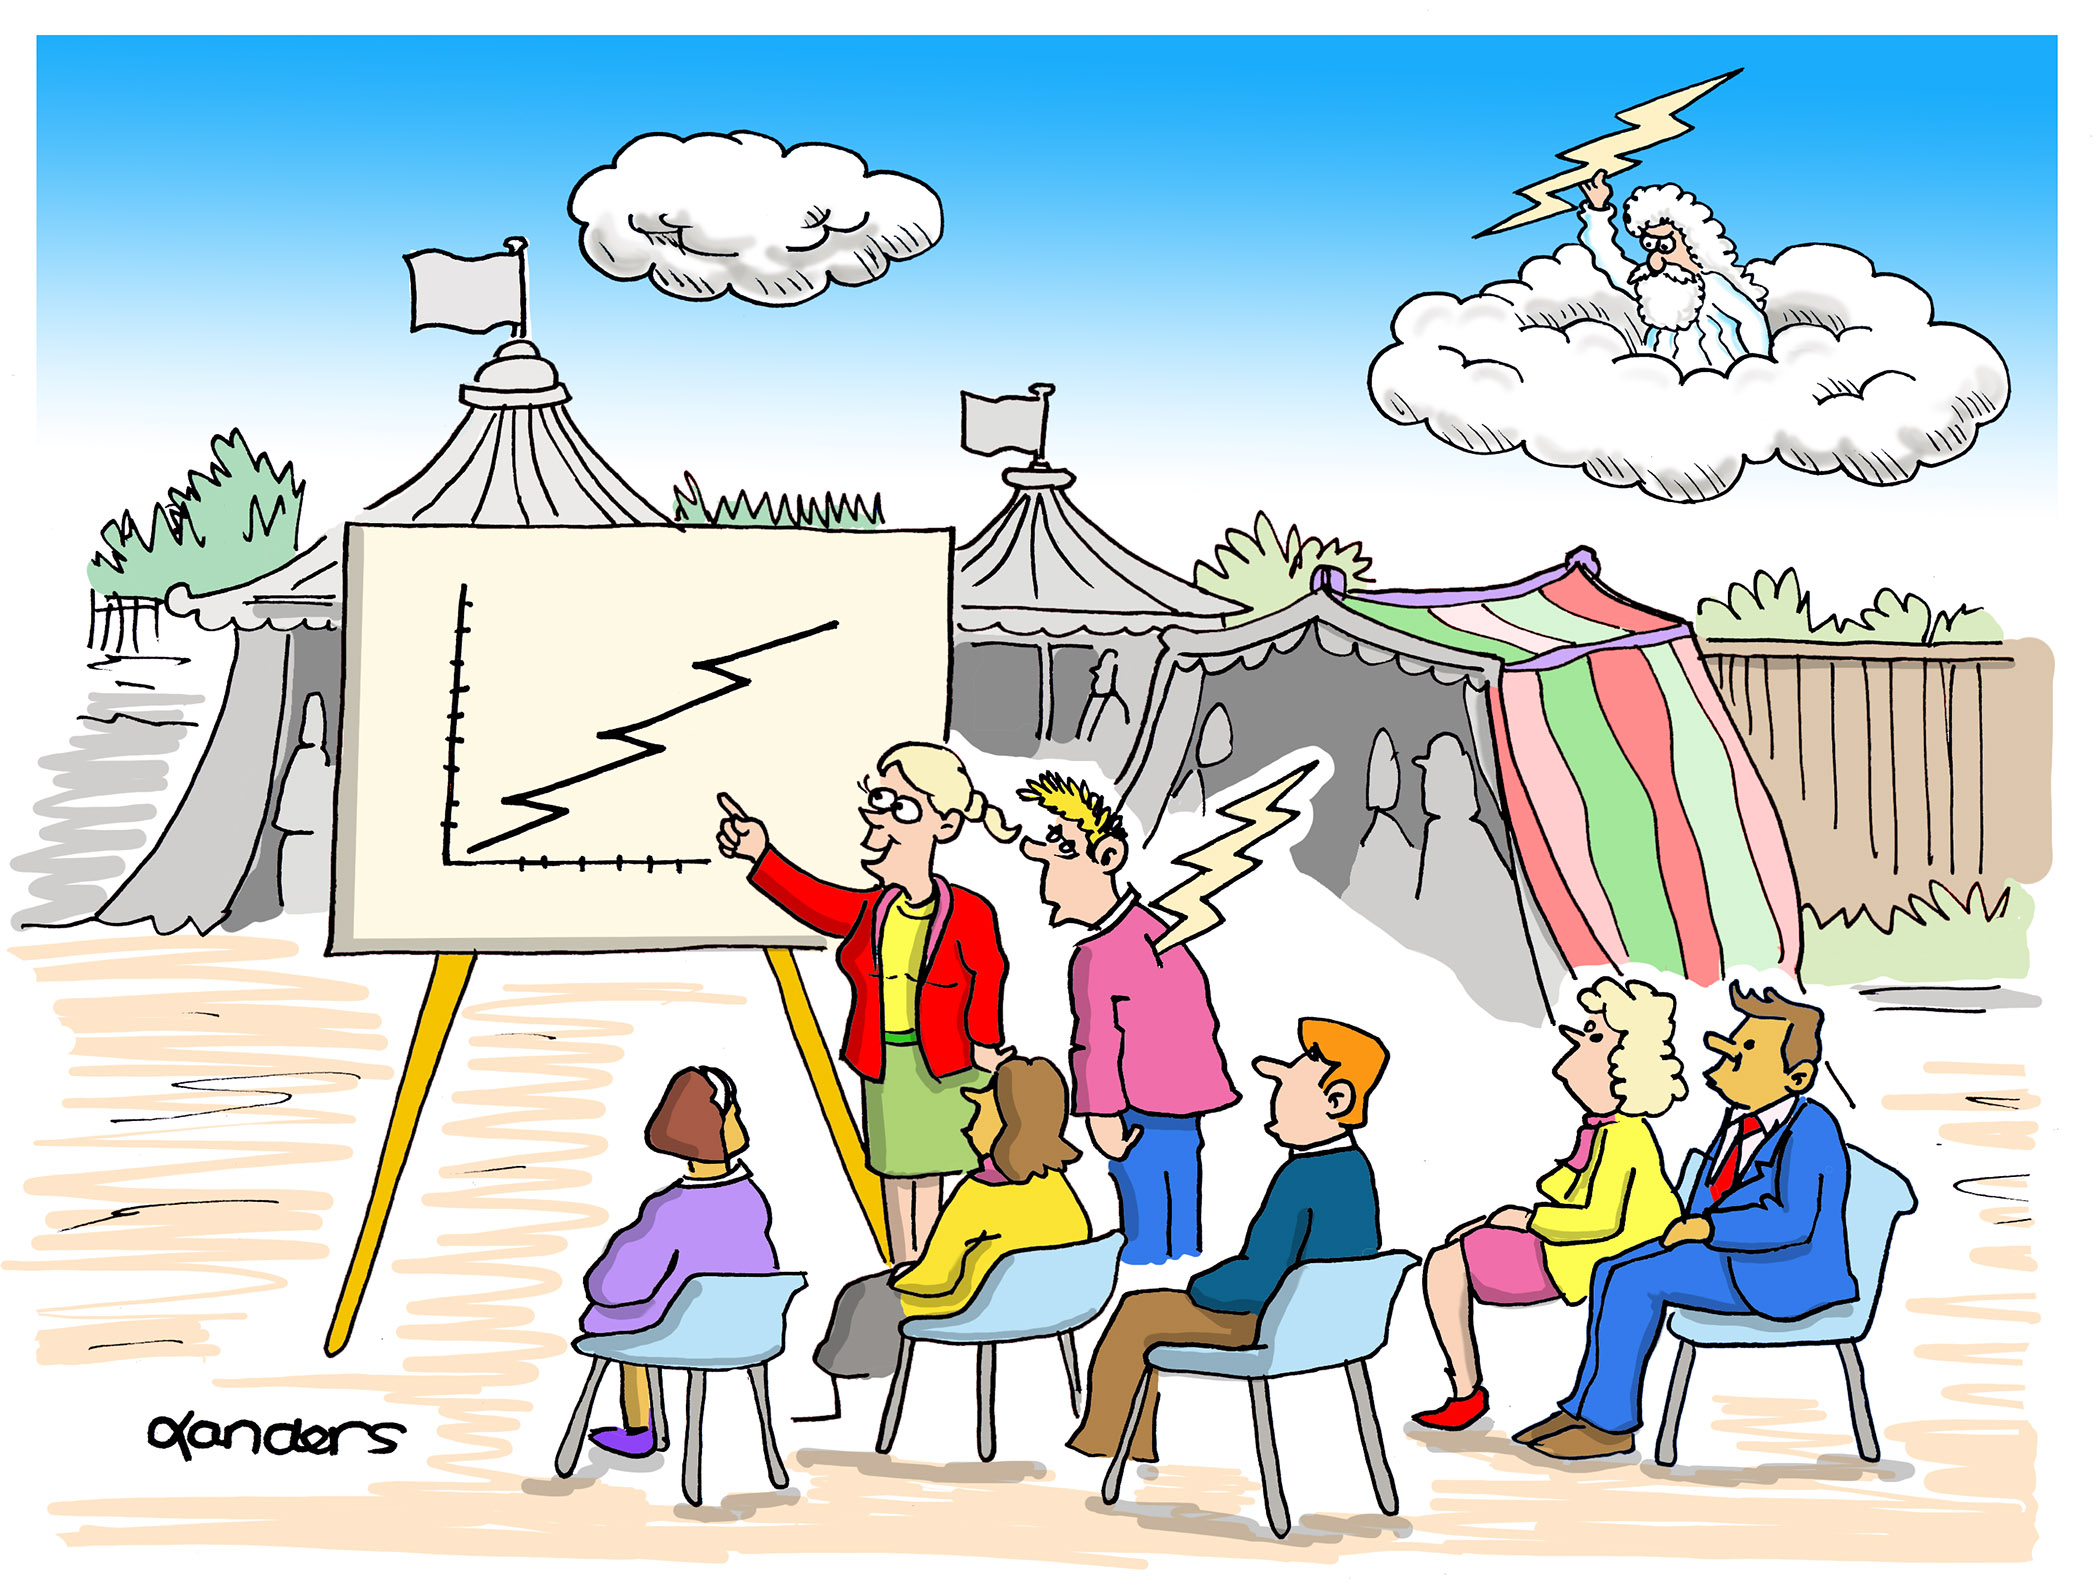
The September caption contest featured a Zeus like character in the clouds throwing lightning bolts. On the ground a woman is giving a presentation to a small group of attentive people – though one person standing up has been hit by one of the bolts. A line graph on the poster presented by the woman shows a pattern that looks like a lightning bolt.
The winning caption for the September contest was "A good plot brings a jolt of understanding," written by Ciaran Evans from Wake Forest University. Ciaran’s caption can be used to help start a class conversation about how good visualizations are important for understanding and communicating data analyses.
An honorable mention this month goes to Greg Baugher of Mercer University for his caption: "Zeta, little-known god of statistics, sends his bolt to mesmerize another student with regression analysis, but in a very non-linear way!," that allows an instructor to discuss the problematic attribute of a time series that looks like a lightning bolt having more than one y-value for the same x (time). A second honorable mention goes to Jim Alloway of EMSQ Associates for his caption: "An effective graph should not require being struck by lightning to see interesting patterns," for discussing how an effective graphical representation should make interesting features jump out at the user.