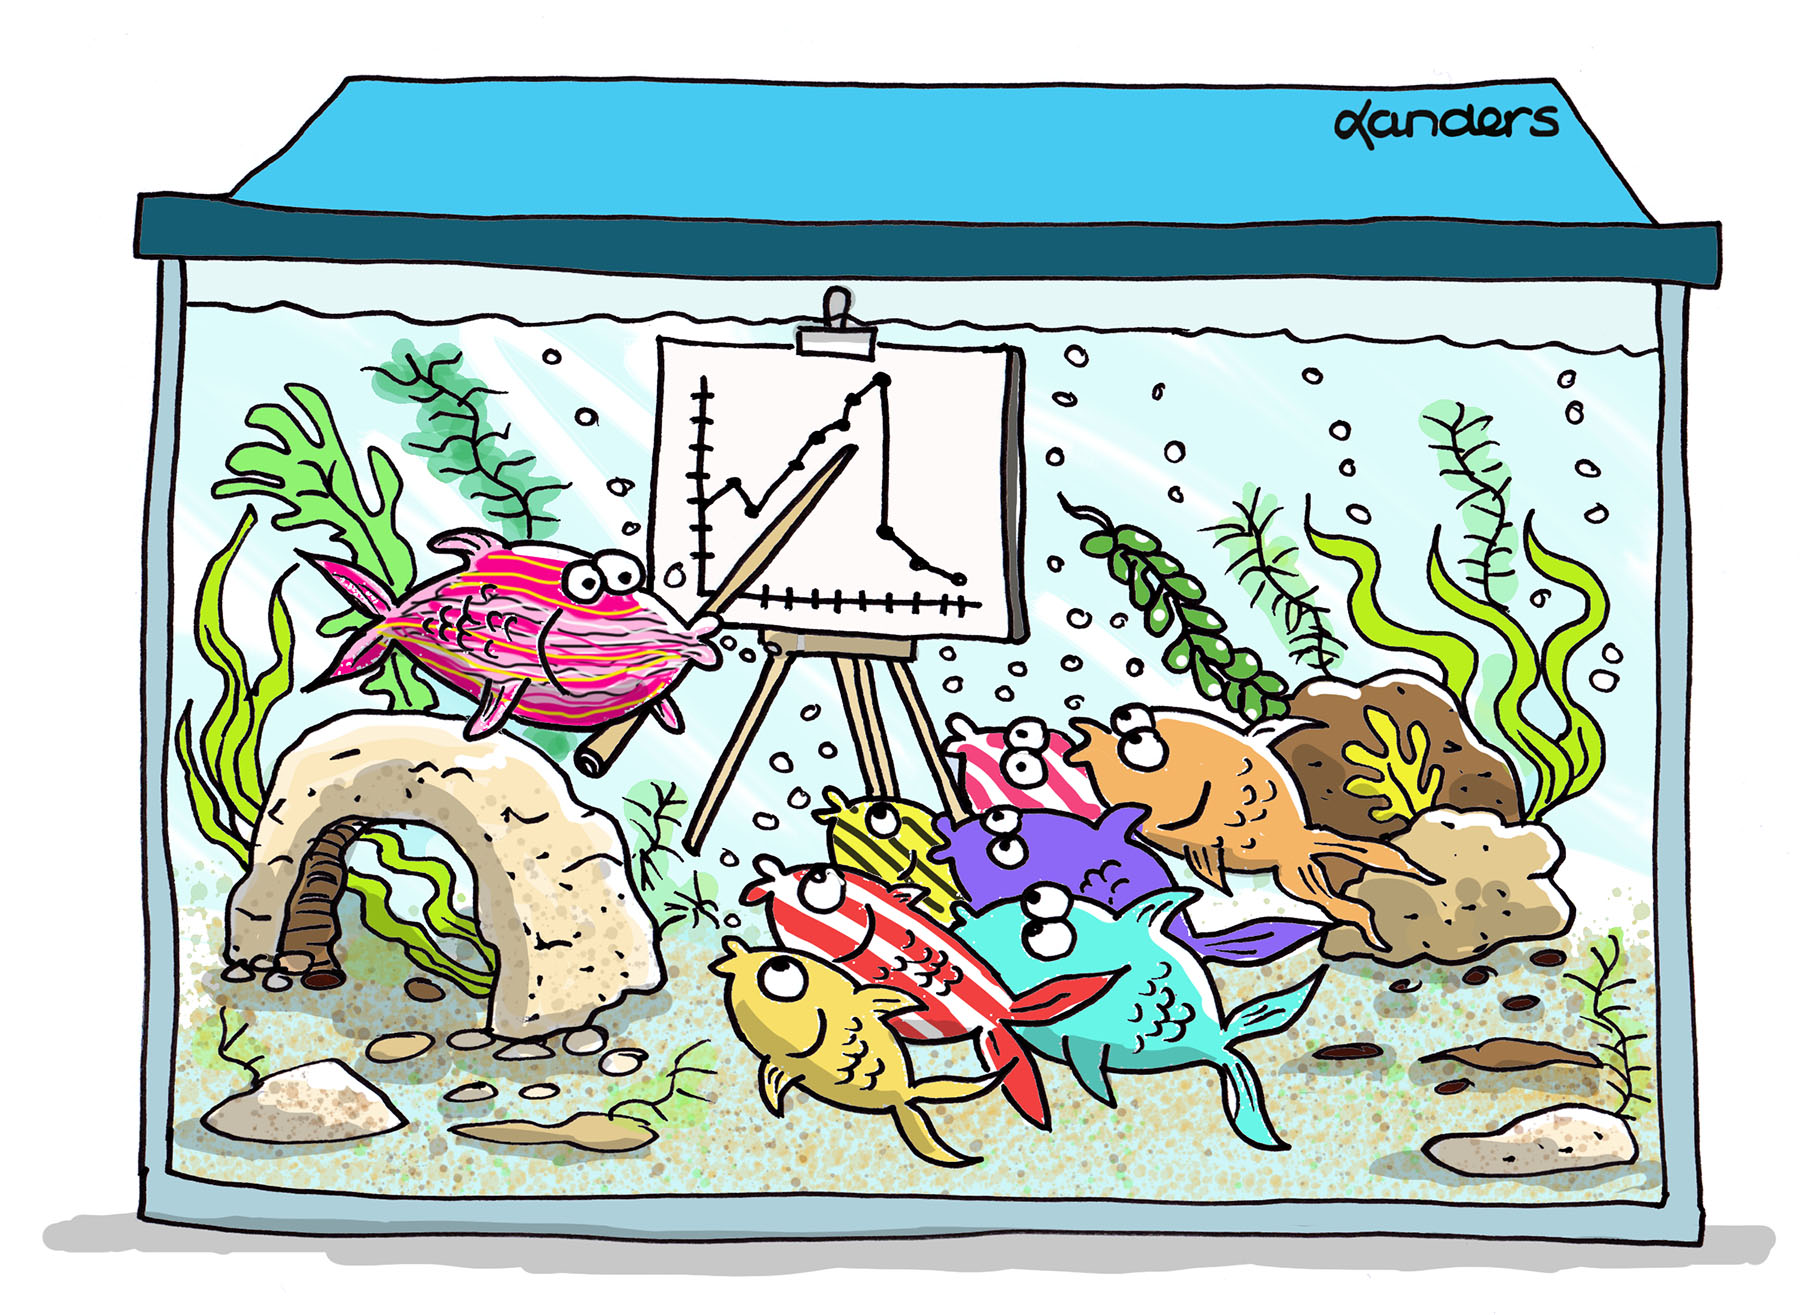
While humans often misrepresent data on graphs, statisfishians are known for their proper scaling.
There were 38 entries for the October caption contest that featured a cartoon showing a fish tank with a group of fish gathered around a chart where another fish is showing them a time series plot that rises and then falls sharply – but the axes on the graph are unlabeled.
The winning caption for the September contest was "While humans often misrepresent data on graphs, statisfishians are known for their proper scaling," written by Chris Lacke from Rowan University. Chris' caption can be used to discuss the importance of proper scaling to give a fair picture in graphical displays.
An honorable mention this month goes to Jim Alloway of EMSQ Associates for his caption "And here’s where we discovered the relationship between aquarium volume and population growth," that would aid in discussing the concept of carrying capacity in population growth models. A second honorable mention goes to Vimal Rao, a student at University of Minnesota, for his caption "The power of visualizations to sea data" providing a pun allowing the cartoon to be used in discussing the power of visualizations for presenting information.
