
2 Feb
2015
2 Feb
'15
3:43 p.m.
Today was Day #1 (We have a short term in January) in my Applied
Statistics class, a course designed for HS juniors & seniors who have not
been "successful" in traditional math classes.
We began by watching the first Unit of [
http://www.learner.org/courses/againstallodds/unitpages/unit01.html
]Against All Odds (What is Statistics?), followed by a discussion of the
following scenario:
A medical practice has 11 pediatricians on its staff, 3 males and 8
females. The CEO of the practice is concerned about the small number of
male pediatricians as he learns that about 40 percent of the pediatricians
in the United States are male, and asks you to investigate whether or not
the number of male pediatricians in the practice is consistent with the
national pool.
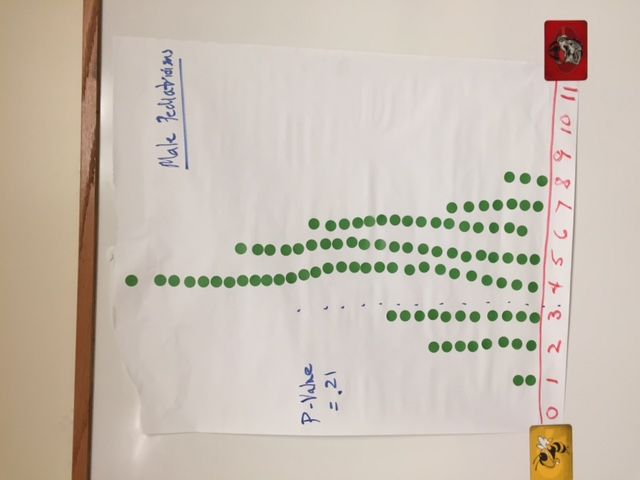
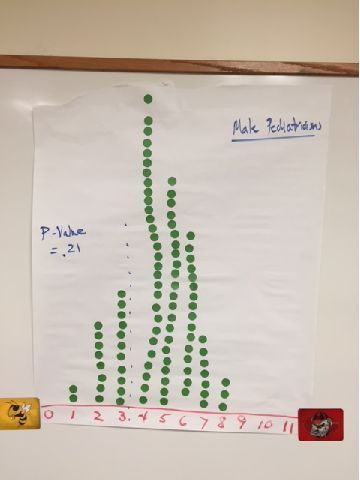
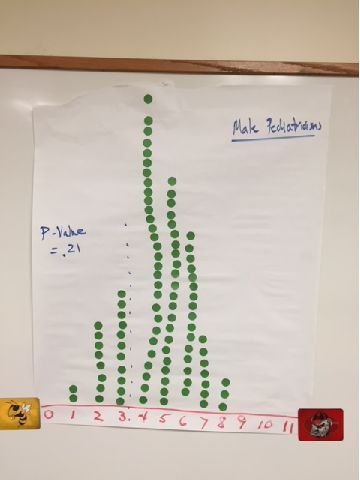
We discussed the CEO's motivation (perhaps a lawsuit!) and the context of
the 40% and the 3/11. Surprisingly, most of the students didn't think the
~27% was "unusual". They were given 11-sided dice and they defined an
appropriate simulation (11 students each did 9 simulations + 1 extra) and
created a dotplot of the number of male pediatricians., followed by a
simulation using the one-proportion applet.
[Image:2215_34129_1.jpg]
We then discussed the significance of our simulated P-Value of 0.21 and
the applet simulated P-value of 0.29.
Quite a first day :)
Paul
**************************************
Paul L. Myers
Mathematics/Statistics Instructor
Mathematics Department Coordinator
AP Statistics Consultant
The Paideia School
Atlanta, GA
[ mailto:myers.paul@paideiaschool.org ]myers.paul(a)paideiaschool.org
**************************************