
2 Feb
2015
2 Feb
'15
12:34 a.m.
Happy Groundhog Day!
I continue to find it inexplicable that neither private colleges nor
public universities see fit to cancel classes out of respect for this
august occasion. But this year I've decided to try to make the best of
this lamentable oversight, and I need your help!
I think it might be fun to ask introductory statistics teachers to
compare notes on what's happening in their classes on one particular
day. What better day than Groundhog Day for revisiting the same
question over and over, and over and over, and over and over, from
multiple perspectives?
I'm writing this after Groundhog Day has officially begun in
Punxsutawney, Pennsylvania, but it's shortly after 9pm on Super Bowl
Sunday here in California. So, to get the ball rolling on this
whimsical idea (I strongly prefer the word "whimsical" to "silly" in
this context), I'll use future tense to anticipate what will happen in
my class on Monday. I plan to be sound asleep when Punxsutawney Phil
makes his celebrated prognostication. (Too much information: Thirty
years ago I did indeed make the trek to Gobbler's Knob with my future
bride before sunrise on February 2, but I won't be up so early or
anywhere near Punxsutawney this year!)
My introductory students and I in STAT 217-09 at Cal Poly will begin the
fifth week of our ten week term on February 2 by finishing up a
discussion of principles of well-designed experiments.We’ll discuss a
study conducted at Harvard about whether students spend $50 differently
depending on whether they’re told that it’s a “tuition rebate” or “bonus
income.”Then we’ll consider one of the first studies of the drug AZT for
reducing mother-to-child transmission of HIV.We’ll culminate this
discussion by collecting some in-class data on a very simple randomized
experiment investigating whether grouping of letters can affect memory.
All students will receive the same 30 letters in the same order, but
some will find convenient, recognizable three-letter groupings and
others will see more irregular groupings of letters.
Then I expect to have time to introduce a study about whether swimming
with dolphins is beneficial to patients who suffer from clinical
depression. We'll discuss the design of the study and do a quick
exploration of the 2x2 table of results, setting the stage for
simulating a randomization test to assess whether the difference between
success proportions in two treatment groups is statistically
significant. Carrying out this simulation in class, using cards and
then an applet, will have to wait until February 3 when the excitement
of the momentous day has passed. (Or who knows, perhaps my students and
I will find when we awake on Tuesday that we are destined to magically
relive Monday again and again...)
Please indulge me in this fanciful exercise by replying to this
Simulation-Based Inference listserv with a description of what happened,
or will happen, in your introductory statistics class on Groundhog Day
2015. Maybe we statistics teachers will learn something interesting by
exchanging this information and reflecting on the variety of
responses.Even if not, we can honor the grand tradition of Groundhog Day
by engaging in a substantially less grand but only marginally more silly
(oops, I mean whimsical) one.
With best wishes for the special day and for an early spring (to those
of you who must endure winter),
Allan Rossman
--
Allan J. Rossman
Professor and Chair
Statistics Department
Cal Poly
San Luis Obispo, CA 93407
arossman(a)calpoly.edu
http://statweb.calpoly.edu/arossman/

2 Feb
2 Feb
11:37 a.m.
This is my plan for tomorrow morning's Intro Stats class: (8:10-9:50)
I put four Excel spreadsheets on Blackboard: one with data re colleges and
universities, one with a cell phone survey data, and two re automobiles. I
will allow ten minutes for groups to create numeric and graphic analyses of
the data sets and present them briefly to the class. (review of types of
variables and appropriate numeric and graphic analysis)
I'll discuss the computation of standard deviation and Z scores and then do
an interactive application of these tools to four worksheets I will have
put on Blackboard and we will complete in class.
After a five minute break, I will introduce a "Friendly Observers" scenario
(24 people randomly assigned to 2 groups; one group performs a skilled task
and is told it will be observed and rewarded monetarily if it exceeds its
prior threshold performance; the other group does not have observers who
will also be rewarded if the performers exceed the threshold and only the
participants will receive a reward. Three persons in the first group
exceed the threshold, and eight in the second group do. The question is:
do vested observers have an effect on performance?)
One group in class will simulate the scenario using playing cards, one with
a random number table, one with a calculator random number generator, and
one with Excel's random generator. Groups will present a graphic of their
results, and we will discuss them without using the language of inference.
(We did Dolphin Therapy two weeks ago on the first day of class)
On Mon, Feb 2, 2015 at 12:34 AM, Allan Rossman <arossman(a)calpoly.edu> wrote:
Happy Groundhog Day!
I continue to find it inexplicable that neither private colleges nor
public universities see fit to cancel classes out of respect for this
august occasion. But this year I've decided to try to make the best of
this lamentable oversight, and I need your help!
I think it might be fun to ask introductory statistics teachers to compare
notes on what's happening in their classes on one particular day. What
better day than Groundhog Day for revisiting the same question over and
over, and over and over, and over and over, from multiple perspectives?
I'm writing this after Groundhog Day has officially begun in Punxsutawney,
Pennsylvania, but it's shortly after 9pm on Super Bowl Sunday here in
California. So, to get the ball rolling on this whimsical idea (I strongly
prefer the word "whimsical" to "silly" in this context), I'll use
future
tense to anticipate what will happen in my class on Monday. I plan to be
sound asleep when Punxsutawney Phil makes his celebrated prognostication.
(Too much information: Thirty years ago I did indeed make the trek to
Gobbler's Knob with my future bride before sunrise on February 2, but I
won't be up so early or anywhere near Punxsutawney this year!)
My introductory students and I in STAT 217-09 at Cal Poly will begin the
fifth week of our ten week term on February 2 by finishing up a discussion
of principles of well-designed experiments. We’ll discuss a study
conducted at Harvard about whether students spend $50 differently depending
on whether they’re told that it’s a “tuition rebate” or “bonus income.” Then
we’ll consider one of the first studies of the drug AZT for reducing
mother-to-child transmission of HIV. We’ll culminate this discussion by
collecting some in-class data on a very simple randomized experiment
investigating whether grouping of letters can affect memory. All students
will receive the same 30 letters in the same order, but some will find
convenient, recognizable three-letter groupings and others will see more
irregular groupings of letters.
Then I expect to have time to introduce a study about whether swimming
with dolphins is beneficial to patients who suffer from clinical
depression. We'll discuss the design of the study and do a quick
exploration of the 2x2 table of results, setting the stage for simulating a
randomization test to assess whether the difference between success
proportions in two treatment groups is statistically significant. Carrying
out this simulation in class, using cards and then an applet, will have to
wait until February 3 when the excitement of the momentous day has passed.
(Or who knows, perhaps my students and I will find when we awake on Tuesday
that we are destined to magically relive Monday again and again...)
Please indulge me in this fanciful exercise by replying to this
Simulation-Based Inference listserv with a description of what happened, or
will happen, in your introductory statistics class on Groundhog Day 2015.
Maybe we statistics teachers will learn something interesting by exchanging
this information and reflecting on the variety of responses. Even if
not, we can honor the grand tradition of Groundhog Day by engaging in a
substantially less grand but only marginally more silly (oops, I mean
whimsical) one.
With best wishes for the special day and for an early spring (to those of
you who must endure winter),
Allan Rossman
--
Allan J. Rossman
Professor and Chair
Statistics Department
Cal Poly
San Luis Obispo, CA 93407arossman@calpoly.eduhttp://statweb.calpoly.edu/arossman/
_______________________________________________
SBI mailing list
SBI(a)causeweb.org
https://www.causeweb.org/mailman/listinfo/sbi

3:40 p.m.
Hello! And happy Groundhog Day to you all –
Tomorrow morning (week five of the 10 week, introductory course - first course in a two
course series) brings me to the start of a required unit on probability.
One of the nice things about teaching at MHCC is that ALL math classes are taught with
students in table groups of 2-4 students, so group activities are a natural and expected
part of students’ experience.
As an introduction, I use a modification of an activity stolen from you guys, Allan and
Beth. Table groups are each given a sheet with four rectangles on it, and the names here
Hermione Hearts, Cathy Clubs, Delila Diamonds, and Sally Spades each in one of the
rectangles. Then we go through the story of the staff at a hospital handing babies back
to their mothers at random, and what is the probability that all four mothers will go home
with the correct baby.
Each table repeats the experiment 10 times, for a total “probability sample” of 90 trials.
We use this to introduce the idea of probability as long-term relative frequency - then
we go back and list all possible outcomes of the experiment as permutations of 1234 and
calculate classical probabilities as well. However we like to emphasize that relative
frequency trumps the classical model - that's how we know that the probability of a
woman having a baby boy is not exactly 50%.
From this activity, we can also develop the ideas of probability distributions based on
relative frequency histograms.
I soft pedal the algebra of probability, instead use Roxy Peck's idea of a
hypothetical sample in a two-way table. I find it helps reinforce the idea of a
categorical variable being separate from the values that variable can take – eg Dorm Type
as the variable as opposed to Co-ed.
Conditional probability and Independence can be taught as concepts springing from the
sample itself, rather than coming from algebraic definitions.
Rob Hauss
Mathematics Instructor
Mt Hood Community College
503 491 7383
From: sbi-bounces(a)causeweb.org [mailto:sbi-bounces@causeweb.org] On Behalf Of Joseph
Oechsle
Sent: Monday, February 02, 2015 8:38 AM
To: Simulation-Based Inference
Subject: Re: [SBI] Happy Groundhog Day! What happened in your introductory statistics
class today?
This is my plan for tomorrow morning's Intro Stats class: (8:10-9:50)
I put four Excel spreadsheets on Blackboard: one with data re colleges and universities,
one with a cell phone survey data, and two re automobiles. I will allow ten minutes for
groups to create numeric and graphic analyses of the data sets and present them briefly to
the class. (review of types of variables and appropriate numeric and graphic analysis)
I'll discuss the computation of standard deviation and Z scores and then do an
interactive application of these tools to four worksheets I will have put on Blackboard
and we will complete in class.
After a five minute break, I will introduce a "Friendly Observers" scenario (24
people randomly assigned to 2 groups; one group performs a skilled task and is told it
will be observed and rewarded monetarily if it exceeds its prior threshold performance;
the other group does not have observers who will also be rewarded if the performers exceed
the threshold and only the participants will receive a reward. Three persons in the first
group exceed the threshold, and eight in the second group do. The question is: do vested
observers have an effect on performance?)
One group in class will simulate the scenario using playing cards, one with a random
number table, one with a calculator random number generator, and one with Excel's
random generator. Groups will present a graphic of their results, and we will discuss
them without using the language of inference.
(We did Dolphin Therapy two weeks ago on the first day of class)
On Mon, Feb 2, 2015 at 12:34 AM, Allan Rossman
<arossman@calpoly.edu<mailto:arossman@calpoly.edu>> wrote:
Happy Groundhog Day!
I continue to find it inexplicable that neither private colleges nor public universities
see fit to cancel classes out of respect for this august occasion. But this year I've
decided to try to make the best of this lamentable oversight, and I need your help!
I think it might be fun to ask introductory statistics teachers to compare notes on
what's happening in their classes on one particular day. What better day than
Groundhog Day for revisiting the same question over and over, and over and over, and over
and over, from multiple perspectives?
I'm writing this after Groundhog Day has officially begun in Punxsutawney,
Pennsylvania, but it's shortly after 9pm on Super Bowl Sunday here in California. So,
to get the ball rolling on this whimsical idea (I strongly prefer the word
"whimsical" to "silly" in this context), I'll use future tense to
anticipate what will happen in my class on Monday. I plan to be sound asleep when
Punxsutawney Phil makes his celebrated prognostication. (Too much information: Thirty
years ago I did indeed make the trek to Gobbler's Knob with my future bride before
sunrise on February 2, but I won't be up so early or anywhere near Punxsutawney this
year!)
My introductory students and I in STAT 217-09 at Cal Poly will begin the fifth week of our
ten week term on February 2 by finishing up a discussion of principles of well-designed
experiments. We’ll discuss a study conducted at Harvard about whether students spend $50
differently depending on whether they’re told that it’s a “tuition rebate” or “bonus
income.” Then we’ll consider one of the first studies of the drug AZT for reducing
mother-to-child transmission of HIV. We’ll culminate this discussion by collecting some
in-class data on a very simple randomized experiment investigating whether grouping of
letters can affect memory. All students will receive the same 30 letters in the same
order, but some will find convenient, recognizable three-letter groupings and others will
see more irregular groupings of letters.
Then I expect to have time to introduce a study about whether swimming with dolphins is
beneficial to patients who suffer from clinical depression. We'll discuss the design
of the study and do a quick exploration of the 2x2 table of results, setting the stage for
simulating a randomization test to assess whether the difference between success
proportions in two treatment groups is statistically significant. Carrying out this
simulation in class, using cards and then an applet, will have to wait until February 3
when the excitement of the momentous day has passed. (Or who knows, perhaps my students
and I will find when we awake on Tuesday that we are destined to magically relive Monday
again and again...)
Please indulge me in this fanciful exercise by replying to this Simulation-Based Inference
listserv with a description of what happened, or will happen, in your introductory
statistics class on Groundhog Day 2015. Maybe we statistics teachers will learn something
interesting by exchanging this information and reflecting on the variety of responses.
Even if not, we can honor the grand tradition of Groundhog Day by engaging in a
substantially less grand but only marginally more silly (oops, I mean whimsical) one.
With best wishes for the special day and for an early spring (to those of you who must
endure winter),
Allan Rossman
--
Allan J. Rossman
Professor and Chair
Statistics Department
Cal Poly
San Luis Obispo, CA 93407
arossman@calpoly.edu<mailto:arossman@calpoly.edu>
http://statweb.calpoly.edu/arossman/
_______________________________________________
SBI mailing list
SBI@causeweb.org<mailto:SBI@causeweb.org>
https://www.causeweb.org/mailman/listinfo/sbi

3:08 p.m.
New subject: Happy Groundhog Day! What happened in your introductory statistics class today?
In my AP Statistics course, we are roughly 2/3 through the curriculum. We have already
studied sampling distributions and confidence intervals for a single mean or proportion.
Today in class we focused on the reasoning of a significance test, using results
from…(wait for it)…simulations! The contexts for the simulation were about a single
proportion, but we were able to extend the reasoning (without doing simulations) to
hypotheses about a single mean and a single standard deviation.
Students generally felt comfortable, as we have done several examples of simulation-based
inference earlier in the year (including day 1).
Happy Groundhog day!
Josh Tabor (joshtabor(a)hotmail.com)
From: sbi-bounces(a)causeweb.org [mailto:sbi-bounces@causeweb.org] On Behalf Of Allan
Rossman
Sent: Sunday, February 01, 2015 10:34 PM
To: Simulation-Based Inference
Subject: [SBI] Happy Groundhog Day! What happened in your introductory statistics class
today?
Happy Groundhog Day!
I continue to find it inexplicable that neither private colleges nor public universities
see fit to cancel classes out of respect for this august occasion. But this year I've
decided to try to make the best of this lamentable oversight, and I need your help!
I think it might be fun to ask introductory statistics teachers to compare notes on
what's happening in their classes on one particular day. What better day than
Groundhog Day for revisiting the same question over and over, and over and over, and over
and over, from multiple perspectives?
I'm writing this after Groundhog Day has officially begun in Punxsutawney,
Pennsylvania, but it's shortly after 9pm on Super Bowl Sunday here in California. So,
to get the ball rolling on this whimsical idea (I strongly prefer the word
"whimsical" to "silly" in this context), I'll use future tense to
anticipate what will happen in my class on Monday. I plan to be sound asleep when
Punxsutawney Phil makes his celebrated prognostication. (Too much information: Thirty
years ago I did indeed make the trek to Gobbler's Knob with my future bride before
sunrise on February 2, but I won't be up so early or anywhere near Punxsutawney this
year!)
My introductory students and I in STAT 217-09 at Cal Poly will begin the fifth week of our
ten week term on February 2 by finishing up a discussion of principles of well-designed
experiments. We’ll discuss a study conducted at Harvard about whether students spend $50
differently depending on whether they’re told that it’s a “tuition rebate” or “bonus
income.” Then we’ll consider one of the first studies of the drug AZT for reducing
mother-to-child transmission of HIV. We’ll culminate this discussion by collecting some
in-class data on a very simple randomized experiment investigating whether grouping of
letters can affect memory. All students will receive the same 30 letters in the same
order, but some will find convenient, recognizable three-letter groupings and others will
see more irregular groupings of letters.
Then I expect to have time to introduce a study about whether swimming with dolphins is
beneficial to patients who suffer from clinical depression. We'll discuss the design
of the study and do a quick exploration of the 2x2 table of results, setting the stage for
simulating a randomization test to assess whether the difference between success
proportions in two treatment groups is statistically significant. Carrying out this
simulation in class, using cards and then an applet, will have to wait until February 3
when the excitement of the momentous day has passed. (Or who knows, perhaps my students
and I will find when we awake on Tuesday that we are destined to magically relive Monday
again and again...)
Please indulge me in this fanciful exercise by replying to this Simulation-Based Inference
listserv with a description of what happened, or will happen, in your introductory
statistics class on Groundhog Day 2015. Maybe we statistics teachers will learn something
interesting by exchanging this information and reflecting on the variety of responses.
Even if not, we can honor the grand tradition of Groundhog Day by engaging in a
substantially less grand but only marginally more silly (oops, I mean whimsical) one.
With best wishes for the special day and for an early spring (to those of you who must
endure winter),
Allan Rossman
--
Allan J. Rossman
Professor and Chair
Statistics Department
Cal Poly
San Luis Obispo, CA 93407
arossman(a)calpoly.edu
http://statweb.calpoly.edu/arossman/

3:43 p.m.
New subject: Happy Groundhog Day! What happened in your introductory statistics
Today was Day #1 (We have a short term in January) in my Applied
Statistics class, a course designed for HS juniors & seniors who have not
been "successful" in traditional math classes.
We began by watching the first Unit of [
http://www.learner.org/courses/againstallodds/unitpages/unit01.html
]Against All Odds (What is Statistics?), followed by a discussion of the
following scenario:
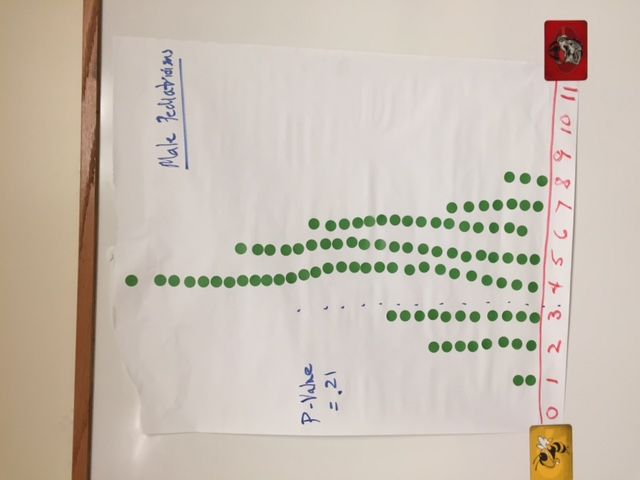
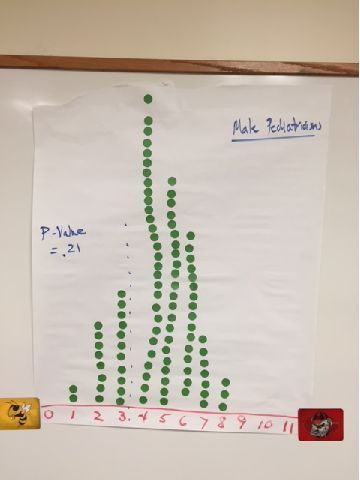
A medical practice has 11 pediatricians on its staff, 3 males and 8
females. The CEO of the practice is concerned about the small number of
male pediatricians as he learns that about 40 percent of the pediatricians
in the United States are male, and asks you to investigate whether or not
the number of male pediatricians in the practice is consistent with the
national pool.
We discussed the CEO's motivation (perhaps a lawsuit!) and the context of
the 40% and the 3/11. Surprisingly, most of the students didn't think the
~27% was "unusual". They were given 11-sided dice and they defined an
appropriate simulation (11 students each did 9 simulations + 1 extra) and
created a dotplot of the number of male pediatricians., followed by a
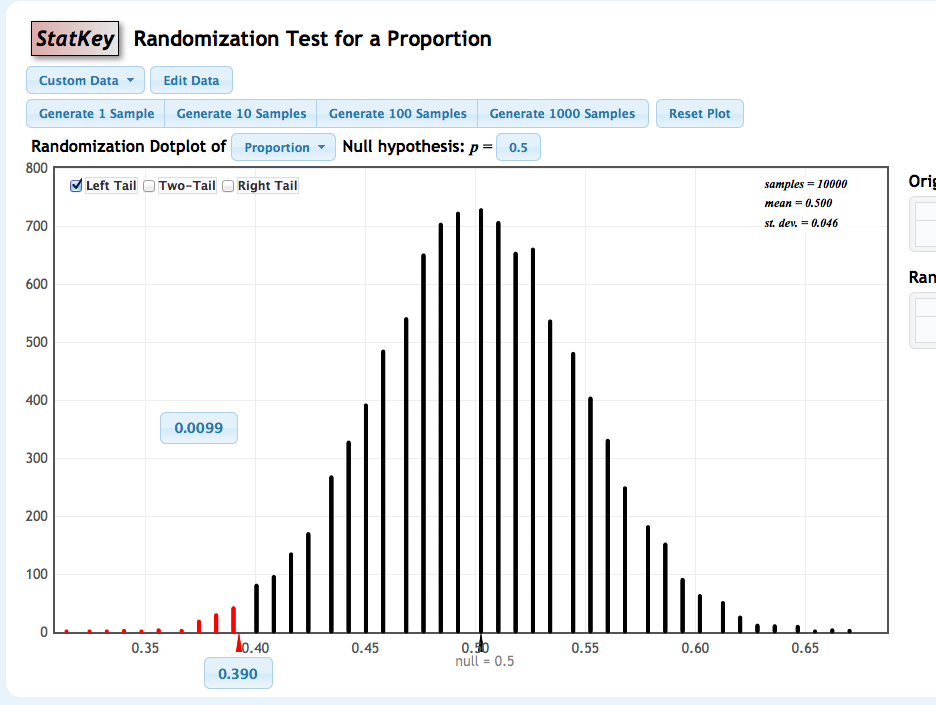
simulation using the one-proportion applet.
[Image:2215_34129_1.jpg]
We then discussed the significance of our simulated P-Value of 0.21 and
the applet simulated P-value of 0.29.
Quite a first day :)
Paul
**************************************
Paul L. Myers
Mathematics/Statistics Instructor
Mathematics Department Coordinator
AP Statistics Consultant
The Paideia School
Atlanta, GA
[ mailto:myers.paul@paideiaschool.org ]myers.paul(a)paideiaschool.org
**************************************

4:01 p.m.
This is great timing Alan, thanks.
My school just got back from a "grand experiment" in doing a
college-style January-term. So, because I have not seen my students
since December, we were reviewing the basics of probability today
(addition/mult rules, independence, mutually exclusive, and conditional
calculations). On a related note, I am REALLY concerned about getting
through the curriculum before the AP exam as a result of this change.
In light of the special day today, I wanted to do a relevant example and
found on some weather site a claim that the Punxsutawney groundhogs
(Phils 1-...??) have been correct only 39% of the time (46 out of 117
attempts). So we talked about the assumption of independence and did
some basic calculations, along with a chance to bring back to their
minds some of the ideas and language of randomization tests. We used
statkey to investigate the probability that Phil would do as poorly as
he seems to do if he decided to flip a coin instead!
Larry Ottman
Germantown Friends School
On 2/2/15 12:34 AM, Allan Rossman wrote:
Happy Groundhog Day!
I continue to find it inexplicable that neither private colleges nor
public universities see fit to cancel classes out of respect for this
august occasion. But this year I've decided to try to make the best
of this lamentable oversight, and I need your help!
I think it might be fun to ask introductory statistics teachers to
compare notes on what's happening in their classes on one particular
day. What better day than Groundhog Day for revisiting the same
question over and over, and over and over, and over and over, from
multiple perspectives?
I'm writing this after Groundhog Day has officially begun in
Punxsutawney, Pennsylvania, but it's shortly after 9pm on Super Bowl
Sunday here in California. So, to get the ball rolling on this
whimsical idea (I strongly prefer the word "whimsical" to "silly" in
this context), I'll use future tense to anticipate what will happen in
my class on Monday. I plan to be sound asleep when Punxsutawney Phil
makes his celebrated prognostication. (Too much information: Thirty
years ago I did indeed make the trek to Gobbler's Knob with my future
bride before sunrise on February 2, but I won't be up so early or
anywhere near Punxsutawney this year!)
My introductory students and I in STAT 217-09 at Cal Poly will begin
the fifth week of our ten week term on February 2 by finishing up a
discussion of principles of well-designed experiments.We’ll discuss a
study conducted at Harvard about whether students spend $50
differently depending on whether they’re told that it’s a “tuition
rebate” or “bonus income.”Then we’ll consider one of the first studies
of the drug AZT for reducing mother-to-child transmission of HIV.We’ll
culminate this discussion by collecting some in-class data on a very
simple randomized experiment investigating whether grouping of letters
can affect memory. All students will receive the same 30 letters in
the same order, but some will find convenient, recognizable
three-letter groupings and others will see more irregular groupings of
letters.
Then I expect to have time to introduce a study about whether swimming
with dolphins is beneficial to patients who suffer from clinical
depression. We'll discuss the design of the study and do a quick
exploration of the 2x2 table of results, setting the stage for
simulating a randomization test to assess whether the difference
between success proportions in two treatment groups is statistically
significant. Carrying out this simulation in class, using cards and
then an applet, will have to wait until February 3 when the excitement
of the momentous day has passed. (Or who knows, perhaps my students
and I will find when we awake on Tuesday that we are destined to
magically relive Monday again and again...)
Please indulge me in this fanciful exercise by replying to this
Simulation-Based Inference listserv with a description of what
happened, or will happen, in your introductory statistics class on
Groundhog Day 2015. Maybe we statistics teachers will learn something
interesting by exchanging this information and reflecting on the
variety of responses.Even if not, we can honor the grand tradition of
Groundhog Day by engaging in a substantially less grand but only
marginally more silly (oops, I mean whimsical) one.
With best wishes for the special day and for an early spring (to those
of you who must endure winter),
Allan Rossman
--
Allan J. Rossman
Professor and Chair
Statistics Department
Cal Poly
San Luis Obispo, CA 93407
arossman(a)calpoly.edu
http://statweb.calpoly.edu/arossman/
_______________________________________________
SBI mailing list
SBI(a)causeweb.org
https://www.causeweb.org/mailman/listinfo/sbi

5:28 p.m.
Allan et al.:
Today was the first day of the semester and I introduced statistics by
talking about the Salk Vaccine trial(s) and, mostly, by talking about
Deflate-gate and a guest blog post that I wrote yesterday:
http://sas-and-r.blogspot.com/. I used some simulation there (along with a
logistic regression model that I did not expect the students to
understand), so in class I first did a physical simulation with n=145
playing cards (kind of hard to shuffle that many) and then turned to an R
script to "shuffle" the cards 10,000 times, which you can read about at the
blog.
Jeff Witmer
On Mon, Feb 2, 2015 at 12:34 AM, Allan Rossman <arossman(a)calpoly.edu> wrote:
Happy Groundhog Day!
I continue to find it inexplicable that neither private colleges nor
public universities see fit to cancel classes out of respect for this
august occasion. But this year I've decided to try to make the best of
this lamentable oversight, and I need your help!
I think it might be fun to ask introductory statistics teachers to compare
notes on what's happening in their classes on one particular day. What
better day than Groundhog Day for revisiting the same question over and
over, and over and over, and over and over, from multiple perspectives?
I'm writing this after Groundhog Day has officially begun in Punxsutawney,
Pennsylvania, but it's shortly after 9pm on Super Bowl Sunday here in
California. So, to get the ball rolling on this whimsical idea (I strongly
prefer the word "whimsical" to "silly" in this context), I'll use
future
tense to anticipate what will happen in my class on Monday. I plan to be
sound asleep when Punxsutawney Phil makes his celebrated prognostication.
(Too much information: Thirty years ago I did indeed make the trek to
Gobbler's Knob with my future bride before sunrise on February 2, but I
won't be up so early or anywhere near Punxsutawney this year!)
My introductory students and I in STAT 217-09 at Cal Poly will begin the
fifth week of our ten week term on February 2 by finishing up a discussion
of principles of well-designed experiments. We’ll discuss a study
conducted at Harvard about whether students spend $50 differently depending
on whether they’re told that it’s a “tuition rebate” or “bonus income.” Then
we’ll consider one of the first studies of the drug AZT for reducing
mother-to-child transmission of HIV. We’ll culminate this discussion by
collecting some in-class data on a very simple randomized experiment
investigating whether grouping of letters can affect memory. All students
will receive the same 30 letters in the same order, but some will find
convenient, recognizable three-letter groupings and others will see more
irregular groupings of letters.
Then I expect to have time to introduce a study about whether swimming
with dolphins is beneficial to patients who suffer from clinical
depression. We'll discuss the design of the study and do a quick
exploration of the 2x2 table of results, setting the stage for simulating a
randomization test to assess whether the difference between success
proportions in two treatment groups is statistically significant. Carrying
out this simulation in class, using cards and then an applet, will have to
wait until February 3 when the excitement of the momentous day has passed.
(Or who knows, perhaps my students and I will find when we awake on Tuesday
that we are destined to magically relive Monday again and again...)
Please indulge me in this fanciful exercise by replying to this
Simulation-Based Inference listserv with a description of what happened, or
will happen, in your introductory statistics class on Groundhog Day 2015.
Maybe we statistics teachers will learn something interesting by exchanging
this information and reflecting on the variety of responses. Even if
not, we can honor the grand tradition of Groundhog Day by engaging in a
substantially less grand but only marginally more silly (oops, I mean
whimsical) one.
With best wishes for the special day and for an early spring (to those of
you who must endure winter),
Allan Rossman
--
Allan J. Rossman
Professor and Chair
Statistics Department
Cal Poly
San Luis Obispo, CA 93407arossman@calpoly.eduhttp://statweb.calpoly.edu/arossman/
_______________________________________________
SBI mailing list
SBI(a)causeweb.org
https://www.causeweb.org/mailman/listinfo/sbi

5:38 p.m.
New subject: Happy Groundhog Day! What happened in your introductory statistics class today?
Hi,
This was “Day 15” (start of week 5) in my intro stat course for math/stat/econ majors. We
just finished Ch. 1 of ISCAM and I handed back exams today. So they had seen the
statistical investigation process, but all in terms of one categorical variable, and today
we were going to start comparing two groups. I started by asking them to raise their hand
if they watched the superbowl and then to raise their hands for male/female, and asked
whether I could now use that data to investigate whether males were more likely to have
watched than females. This seemed to generate some reasonable discussion that led to the
need for conditional proportions. So then we did an example of hearing loss levels among
teens “now” (2005-6) vs. a few years ago (early 90s) from NHANES data. (The speculation
that heavier use of ear buds is causing problems.) We went through the basics of two-way
tables, difference in conditional proportions, segmented bar graphs with these data. Then
in this class we have them simulate taking independent random samples from two binomial
processes with the same probability of success, generate a null distribution for the
difference in sample proportions, and then review/introduce the p-value as a way to
measure how unusual the statistic is. Tomorrow we move on to the two-sample z-test.
HGD,
Beth
Happy Groundhog Day!
I continue to find it inexplicable that neither private colleges nor public universities
see fit to cancel classes out of respect for this august occasion. But this year I've
decided to try to make the best of this lamentable oversight, and I need your help!
I think it might be fun to ask introductory statistics teachers to compare notes on
what's happening in their classes on one particular day. What better day than
Groundhog Day for revisiting the same question over and over, and over and over, and over
and over, from multiple perspectives?
I'm writing this after Groundhog Day has officially begun in Punxsutawney,
Pennsylvania, but it's shortly after 9pm on Super Bowl Sunday here in California. So,
to get the ball rolling on this whimsical idea (I strongly prefer the word
"whimsical" to "silly" in this context), I'll use future tense to
anticipate what will happen in my class on Monday. I plan to be sound asleep when
Punxsutawney Phil makes his celebrated prognostication. (Too much information: Thirty
years ago I did indeed make the trek to Gobbler's Knob with my future bride before
sunrise on February 2, but I won't be up so early or anywhere near Punxsutawney this
year!)
My introductory students and I in STAT 217-09 at Cal Poly will begin the fifth week of our
ten week term on February 2 by finishing up a discussion of principles of well-designed
experiments. We’ll discuss a study conducted at Harvard about whether students spend $50
differently depending on whether they’re told that it’s a “tuition rebate” or “bonus
income.” Then we’ll consider one of the first studies of the drug AZT for reducing
mother-to-child transmission of HIV. We’ll culminate this discussion by collecting some
in-class data on a very simple randomized experiment investigating whether grouping of
letters can affect memory. All students will receive the same 30 letters in the same
order, but some will find convenient, recognizable three-letter groupings and others will
see more irregular groupings of letters.
Then I expect to have time to introduce a study about whether swimming with dolphins is
beneficial to patients who suffer from clinical depression. We'll discuss the design
of the study and do a quick exploration of the 2x2 table of results, setting the stage for
simulating a randomization test to assess whether the difference between success
proportions in two treatment groups is statistically significant. Carrying out this
simulation in class, using cards and then an applet, will have to wait until February 3
when the excitement of the momentous day has passed. (Or who knows, perhaps my students
and I will find when we awake on Tuesday that we are destined to magically relive Monday
again and again...)
Please indulge me in this fanciful exercise by replying to this Simulation-Based Inference
listserv with a description of what happened, or will happen, in your introductory
statistics class on Groundhog Day 2015. Maybe we statistics teachers will learn something
interesting by exchanging this information and reflecting on the variety of responses.
Even if not, we can honor the grand tradition of Groundhog Day by engaging in a
substantially less grand but only marginally more silly (oops, I mean whimsical) one.
With best wishes for the special day and for an early spring (to those of you who must
endure winter),
Allan Rossman
--
Allan J. Rossman
Professor and Chair
Statistics Department
Cal Poly
San Luis Obispo, CA 93407
arossman(a)calpoly.edu
http://statweb.calpoly.edu/arossman/
_______________________________________________
SBI mailing list
SBI(a)causeweb.org
https://www.causeweb.org/mailman/listinfo/sbi

9:50 p.m.
Allan, et al -
Nice idea! Saw your message right after I came out of class and
should have responded then when it was fresh. This was day 9 of a 42
class semester and we're finishing up the chapter on descriptive
statistics/graphics (after initial classes on data production, sampling,
experiments). First exam is later this week and first project
(describing their own dataset) is also due at the end of the week.
Today's topic was least squares regression (after doing
scatterplots and correlation last class). Started with a Fathom demo
where students put a movable line on a scatterplot to show the trend (we
meet full time in a computer classroom), had Fathom show the "squares"
and find SSE to see whose line was best. Then let them move their lines
around to try to lower SSE until they found essentially the least
squares line.
Once they saw how to find the fit automatically in Fathom we looked
at several situations: Hgt to predict Wgt (interpreting the slope),
population of countries to predict land area (showing influential
points/outliers), presidential approval rating as a predictor of
election margin, page number in Consumer Report Guide to predict fuel
capacity of a car (no relationship). They then did another Fathom demo,
dragging a point around to see the effect on the least squares line,
especially when the the point became very influential.
We finished up by introducing r^2 as the proportion of variability
in response explained by the predictor. This involved one more Fathom
demo where they made the movable line horizontal to see that the "best"
constant is the mean, giving the total variability as its sum of squared
errors, then found the "improvement" with the least squares line to
measure the variability explained by the predictor.
Lots of Fathom today, but that changes next class (Wednesday) when
we switch to StatKey and start in on simulations to lead to bootstrap
confidence intervals - a topic more relevant to this list.
Robin Lock
St. Lawrence University
On 2/2/2015 12:34 AM, Allan Rossman wrote:
Happy Groundhog Day!
I continue to find it inexplicable that neither private colleges nor
public universities see fit to cancel classes out of respect for this
august occasion. But this year I've decided to try to make the best
of this lamentable oversight, and I need your help!
I think it might be fun to ask introductory statistics teachers to
compare notes on what's happening in their classes on one particular
day. What better day than Groundhog Day for revisiting the same
question over and over, and over and over, and over and over, from
multiple perspectives?
I'm writing this after Groundhog Day has officially begun in
Punxsutawney, Pennsylvania, but it's shortly after 9pm on Super Bowl
Sunday here in California. So, to get the ball rolling on this
whimsical idea (I strongly prefer the word "whimsical" to "silly" in
this context), I'll use future tense to anticipate what will happen in
my class on Monday. I plan to be sound asleep when Punxsutawney Phil
makes his celebrated prognostication. (Too much information: Thirty
years ago I did indeed make the trek to Gobbler's Knob with my future
bride before sunrise on February 2, but I won't be up so early or
anywhere near Punxsutawney this year!)
My introductory students and I in STAT 217-09 at Cal Poly will begin
the fifth week of our ten week term on February 2 by finishing up a
discussion of principles of well-designed experiments.We’ll discuss a
study conducted at Harvard about whether students spend $50
differently depending on whether they’re told that it’s a “tuition
rebate” or “bonus income.”Then we’ll consider one of the first studies
of the drug AZT for reducing mother-to-child transmission of HIV.We’ll
culminate this discussion by collecting some in-class data on a very
simple randomized experiment investigating whether grouping of letters
can affect memory. All students will receive the same 30 letters in
the same order, but some will find convenient, recognizable
three-letter groupings and others will see more irregular groupings of
letters.
Then I expect to have time to introduce a study about whether swimming
with dolphins is beneficial to patients who suffer from clinical
depression. We'll discuss the design of the study and do a quick
exploration of the 2x2 table of results, setting the stage for
simulating a randomization test to assess whether the difference
between success proportions in two treatment groups is statistically
significant. Carrying out this simulation in class, using cards and
then an applet, will have to wait until February 3 when the excitement
of the momentous day has passed. (Or who knows, perhaps my students
and I will find when we awake on Tuesday that we are destined to
magically relive Monday again and again...)
Please indulge me in this fanciful exercise by replying to this
Simulation-Based Inference listserv with a description of what
happened, or will happen, in your introductory statistics class on
Groundhog Day 2015. Maybe we statistics teachers will learn something
interesting by exchanging this information and reflecting on the
variety of responses.Even if not, we can honor the grand tradition of
Groundhog Day by engaging in a substantially less grand but only
marginally more silly (oops, I mean whimsical) one.
With best wishes for the special day and for an early spring (to those
of you who must endure winter),
Allan Rossman
--
Allan J. Rossman
Professor and Chair
Statistics Department
Cal Poly
San Luis Obispo, CA 93407
arossman(a)calpoly.edu
http://statweb.calpoly.edu/arossman/
_______________________________________________
SBI mailing list
SBI(a)causeweb.org
https://www.causeweb.org/mailman/listinfo/sbi
--
Robin Lock
Burry Professor of Statistics
St. Lawrence University
3379
days inactive
3380
days old
8 comments
9 participants
participants (9)
-
 Allan Rossman
 -
 Beth Chance
 -
 Jeff Witmer
 -
 Joseph Oechsle
 -
 Josh Tabor
 -
 Larry Ottman
 -
 Paul Myers
 -
 Robert Hauss
 -
 Robin Lock