Chance News 8: Difference between revisions
| Line 102: | Line 102: | ||
Thus if you buy a single ticket the probability of having a winning ticket is | Thus if you buy a single ticket the probability of having a winning ticket is | ||
<center> 1/ | <center> <math>{1} \over {146107962}</math> = .000000006844...</center> | ||
The powerball website and the media expresses this by saying that the odds that you have a winning ticket is 1 in 146,107,962 . We would say the odds are 1 to 146,107,961. | The powerball website and the media expresses this by saying that the odds that you have a winning ticket is 1 in 146,107,962 . We would say the odds are 1 to 146,107,961. | ||
| Line 118: | Line 118: | ||
Note that neither of these are completely clear. Bressoud does not say what it means to "expect to win" and Arnold does not say what a groujp of Powerball numbers are. We can clarify these by simple calclulations (simple for mathematica). Let q(n) be the probability that you fail to to get a winning ticket in n lottery drawings. Then: | Note that neither of these are completely clear. Bressoud does not say what it means to "expect to win" and Arnold does not say what a groujp of Powerball numbers are. We can clarify these by simple calclulations (simple for mathematica). Let q(n) be the probability that you fail to to get a winning ticket in n lottery drawings. Then: | ||
<math> | <math> \frac{146107961}{146107962}</math> | ||
Arnold adds that you have a seven times better chance of becoming a saint. And Bressoud notes that you're six times more likely to get elected president of the United States.</blockquote> | Arnold adds that you have a seven times better chance of becoming a saint. And Bressoud notes that you're six times more likely to get elected president of the United States.</blockquote> | ||
Revision as of 18:36, 28 October 2005
Oct 15 to Oct 30
Quotation
One more fagot of these adamantine bandages, is, the new science of Statistics. It is a rule, that the most casual and extraordinary events -- if the basis of population is broad enough -- become matter of fixed calculation. It would not be safe to say when a captain like Bonaparte, a singer like Jenny Lind, or a navigator like Bowditch, would be born in Boston: but, on a population of twenty or two hundred millions, something like accuracy may be had. Ralph Waldo Emerson Fate
Forsooth
Here's another Forsooth from the October issue of RSS News.
Your'e more likely to die in a fire in Strathclyde than anywhere else in the country
11 May 2005
The Poisson distribution and the Supreme Court
The Poisson distribution and the Supreme Court
Journal of the American Statistical Association 31, no. 195 ,(1936), 376-80
W. Allen Wallis
Supreme Court Appointments as a Poisson distribution
American Journal of Political Science, 26, No.1, February 1982
S. Sidney Ulmer
This is not current news, but since Supreme Court appointments are in the news we felt that these articles might make an interesting class discussion.
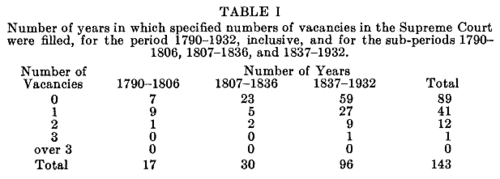
In 1936 statistician Allen Wallis suggested that a Poisson distribution can approximate the number of U.S. Supreme Court appointments in a given year. In his Table 1 Wallis provided the number appointed in each year over the intervals with different numbers of Justices on the Supreme Court: 1790-1806 (6) 1807-1836 (7), and 1837-1932 (9). Actually there were 10 in the years 1963 to 1967 which Wallis called "negligible exceptions."
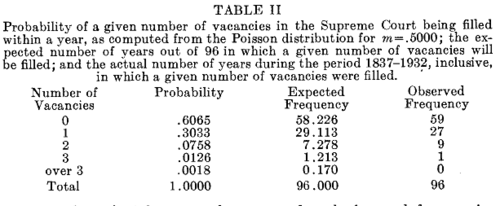
Wallis then restricts himself to the years 1837-1932 and finds that a Poisson distribution with mean .5 can approximate the number of court appointments in a year. His results are shown in his Figure II:
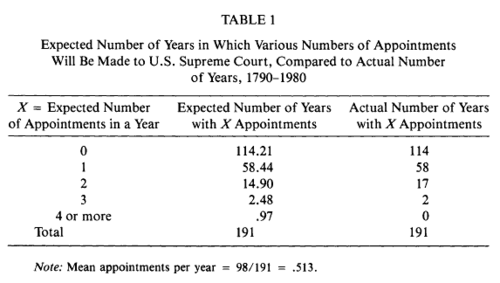
In his article, Sidney Ulmer updated the data to 1980 and also includes data from the early Supreme Courts with 6 and 7 members. Thus his data covers the years 1790--1980. His Table 1 compares the actual number of appointments in a year with the expected number of appointments assuming a Poisson distribution with mean 5.13.
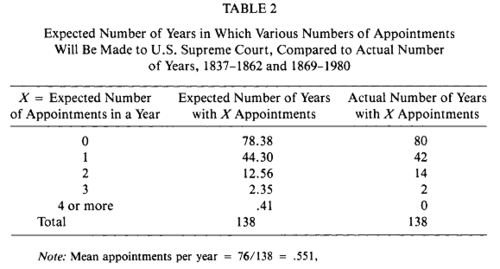
In his Table II Ulmer limits the data to the 9 member Supreme Courts: 1837 to 1862 and 1869-1980).
Testing the goodness of fits, Ulmer argues that the fit with the varying size Supreme Courts is just as good as with fixed size Supreme Courts.
DISCUSSION
(1) What is the probability that a President will make 2 or more appointments to the Supreme Court during a 4-year term? What is the probability a President makes no appointments during a 4-year term? Has this ever happened?
(2) Do you agree with Ulmer that there is no reason to limit the data to years with the Supreme Court is the same size?
(3) Obtain the data needed to update Ulmer's results to 1980 and provide Tables that correspond to Ulmer's Tables 1 and 2. Add your Tables to this Chance News and make your data available to make it easier to update this in future years.
(1) Find the probability that a President who serves four years will make 2 or more Supreme Court appointments.
(2) Obtain the data from 1790 to 2005 and make tables corresponding to the Ulmer's Tables 1 and 2. Add the tables to this article and also include the data to make it easier to update these results in future years.
Possible Cancer Cluster in Connecticut
Pratt Agrees to Increase Funding for Brain Cancer Study
The Associated Press
October 11, 2005
Stephen Singer
In a case that seems eerily familiar to the leukemia cancer cluster made famous by the book and movie, A Civil Action, researchers are trying to determine whether or not a cancer cluster exists among workers at Pratt & Whitney, a company that manufactures jet engines. Over one hundred former or current Pratt & Whitney employees have been identified as having a relatively rare type of fatal brain tumor known as glioblastoma multiforme, which strikes 3 people per 100,000 every year. Many of these workers have been exposed to metals and chemical substances, including TCE (trichloroethylene), which is an engine degreaser. TCE is the same carcinogenic chemical that was dumped in the 1960’s and 1970’s by the chemical company, WR Grace, in Woburn, MA, and that was found to have contaminated the drinking water in two of the town’s wells.
Prior to the recent announcement that the funding is being increased from $6 million dollars to $12 million dollars, this medical study was already being described as the largest occupational health study ever conducted. It covers 250,000 people who worked at any of the seven Connecticut Pratt & Whitney plants from 1952 to 2001. So far, at least 125 cases of brain cancer have been documented, according to the lawyer who represents dozens of individuals and family members.
The study falls under the auspices of the Connecticut Department of Public Health. However, due to the overwhelming cost and scope of the study, Pratt & Whitney is funding the project. Since Pratt is paying for the study, they chose the researchers, a team from the University of Pittsburgh. The project began three years ago, and the results are expected to be available between 2007 and 2009.
In the meantime, this case faces many of the obstacles common in the quest to establish whether or not a cancer cluster exists, such as proving causation, the fact that it can take a long time (sometimes 5-40 years) after exposure for true problems to show up, and finding the people who were exposed & convincing them to participate in the study. Additionally, there are legal difficulties for the families involved, including Connecticut’s statute of limitations laws, the length of time it takes investigators to reach a conclusion, the cost of litigation, and the “deep pockets” of a company like Pratt & Whitney.
This case study provides a current example of an ongoing investigation into a possible cancer cluster. Will it ultimately be found to be a coincidence cluster or proven to be a true cancer cluster? Does it make sense that the researchers are including in the study everyone who worked at Pratt over a fifty year period, even those who only worked there for a brief time period and those who were not directly exposed to toxic substances (i.e. office workers)? Could the researchers possibly have an unconscious bias in favor of the company that is funding their research? If the company doesn’t fund the research, then who should? Is there some other way to structure such investigations, so that the company involved pays for the study, but is not allowed to choose the researchers and directly fund them?
Further Reading
• “Rare Cancer Found in Workers”, The New York Times, March 10, 2002, Jane Gordon
• “Scientist: Pratt Commits to Cancer Study”, The Hartford Courant, May 19, 2005
• “Participation in Cancer Study at Pratt Lagging”, The Hartford Courant, October 12, 2005, Paul Marks
• The New Haven Advocate has had more than a dozen articles that explain the working conditions at Pratt & Whitney, and also chronicle the history & progression of this case. These articles have been investigated and written primarily by Carole Bass, Associate Editor. A few of the articles are listed below.
-“Worked to Death”, August 2, 2001, Carole Bass & Camille Jackson
-“Talking Cure”, October 28, 2004, Dave Goldberg
-“Time’s Not on Their Side”, January 20, 2005, Carole Bass
-“The Brains Behind the Brain”, October 20, 2005, Carole Bass
For the early New Haven Advocate articles (i.e., 2001-2002) on this subject, go to http://old.newhavenadvocate.com/workedtodeath/index.html
For the articles since 2002, go to
http://www.newhavenadvocate.com and search for Pratt & Whitney.
Submitted by Josephine Rodriguez.
A record powerball lottery jackpot
On Saturday Oct 22, 2005 the powerball lottery had a record powerball jackpot of 340 million dollars.
In this lottery, when you buy a ticket, you specify five distinct numbers from 1 to 55 which we call basic numbers and independent of this another number from 1 to 42 is chosen as the bonus number. To win the Jackpot your 5 basic numbers and your bonus number much agree with a similar choice of basic numbers and a bonus number chosen by the lottery officials. The number possible tickets is then
Thus if you buy a single ticket the probability of having a winning ticket is
The powerball website and the media expresses this by saying that the odds that you have a winning ticket is 1 in 146,107,962 . We would say the odds are 1 to 146,107,961.
Whenever there is a record jackpot the newswriters try to compare this to other rare events that might be more familiar to it's readers. In an article for the Omaha World-Herald Oct 18, 2005 , Robynn Tysver writes:
You have a greater chance of getting killed by lightning than winning this week's 340 million Powerball jackpot. You also have a greater chance of drowning in a bathtub. The lifetime odds of getting killed by lightning are one in 56,439, and the lifetime odds of dying while in or falling into a bathtub are one in 10,582, according to the National Íafety Council.
These are not even in the ballpark. The Minneapolis Star Tribune consulted mathematicians David Bressoud and Douglas Arnold who contribute the following:
Bressoud: "If you buy 10 tickets a week, every week, it would take you 280,000 years before you could expect to win."
Arnold: "If you were to select a group of Powerball numbers every minute for 138 years, you would have about a 50 percent chance of picking the winning Powerball ticket."
Note that neither of these are completely clear. Bressoud does not say what it means to "expect to win" and Arnold does not say what a groujp of Powerball numbers are. We can clarify these by simple calclulations (simple for mathematica). Let q(n) be the probability that you fail to to get a winning ticket in n lottery drawings. Then:
<math> \frac{146107961}{146107962}</math>
Arnold adds that you have a seven times better chance of becoming a saint. And Bressoud notes that you're six times more likely to get elected president of the United States.
My own favorite was suggested by Fred Hoppe: if you toss a coin 27 times your chance of getting 27 heads in a row is greater than your chance of winning the Powerball jackpot. (<math> 2^{27} = 134217728</math> and so there are 134,217,728 possible sequences of heads and tales and only 1 has all heads.)
Mammograms Validated as Key in Cancer Fight
The New York Times reported on October 27, 2005 on a new National Cancer Institute study that attributed a significant decrease in the death rate from breast cancer to mammogram screening tests. The study, published in the New England Journal of Medicine, found that from 28% to 65% of the sharp 24% decrease in breast cancer death rates from 1990 to 2000 was due to screening; the remainder was attributed to new drugs used to treat the disease.
Prior to this study, the value of mammogram screening had been disputed, for several reasons. In the general population, the test results in a large proportion number of false positives, about 90%. Thus, many women who are cancer-free are subjected to unnecessary procedures. Also, approximately 30% of cancers that are detected and treated would not have progressed significantly. Unfortunately, it isn't possible to distinguish between these so-called indolent cancers and those that become life-threatening, so it is routine practice to treat them all.
The new study suggests that the benefits of routine mammography are more certain than earlier believed, according to Don Berry, Chairman of the biostatistics department of M. D. Anderson Cancer Center, in Houston, Texas, and the lead author of the paper. He said that the new study for the first time properly separates the effects of therapy and screening. Nonetheless, he cautioned that mammography does pose risks, and recommended that women be counselled before screening.
Contributed by Bill Jefferys


