
 Beth Chance, Cal Poly – San Luis Obispo
My technology use has definitely evolved, including in ways that surprise me! In particular, I have switched from being a long-time advocate of Minitab to not using a standard statistical package in the course at all. In reflecting on why this was the case, I realized I had some guiding principles: [pullquote]I want student to see simulation-based methods as equally legitimate to theory-based procedures, if not preferred in some situations. [/pullquote]
- Wanting the technology to have as small a learning curve as possible (this includes being very portable and preferably free to students!)
- Ensuring the technology is enhancing (and not distracting from the) learning of the course material
- Giving students a sense that they are doing statistics
- Helping students visualize the reasoning of statistical inference.
The main reason I like Minitab is I do feel it is fairly easy for students to learn and enables a quick transition to other software packages. I especially appreciated when Minitab added the Probability Distribution Plot option so students could be expected to produce and provide output showing the area under a curve corresponding to the p-value and keeping that a bit more tangible, without a day’s lecture on how to read a probability table. However, this was still a separate step from running a test of significance – why can’t they appear together? I also made use of Minitab macros for students to carry out simulations (e.g., repeated sampling), but getting the simulation to run became more of the focus rather than on the concept I wanted to illustrate. I also had more and more trouble with students using Macintoshes not being able to run Minitab easily and without technical support. So at Cal Poly we also began using JMP. I think the learning curve on JMP is a tad steeper than Minitab, especially for introductory statistics students, and there are definitely some “features” I’m not a big fan of (e.g., horizontal layout, mosaic plots). Many of these features can be adjusted through setting preferences, but again, that moves the technology to become the focus rather than the statistical ideas.
So I began making more and more use of applets, 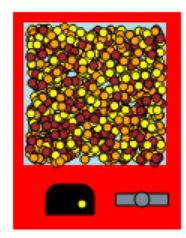 mostly for the dynamic visualizations of the process of statistical inference, but also going beyond that to be a stand-alone analysis tool as well. The Reese’s Pieces applet (click image for applet) was always a favorite of students and we quickly began to see advantages of a computer simulation that directly mimicked what students did in class beforehand. We wanted to make sure the computer was not becoming a black box, but acted as a straightforward extension of what students did through tactile simulations.
We also began to see advantages to having a consistent look and feel across the applets to make the transitions easier for students. (We have recently converted all the applets for the ISI curriculum to be java-script and to have that consistency across the applets. This collection is now sufficient for the topics in my introductory course.) We wanted to make sure the applets still enabled the students to explore ideas on their own, like changes in sample size, as quickly as possible and immediately seeing the effect; this allows students to tell the instructor what the impact was rather than the other way around.
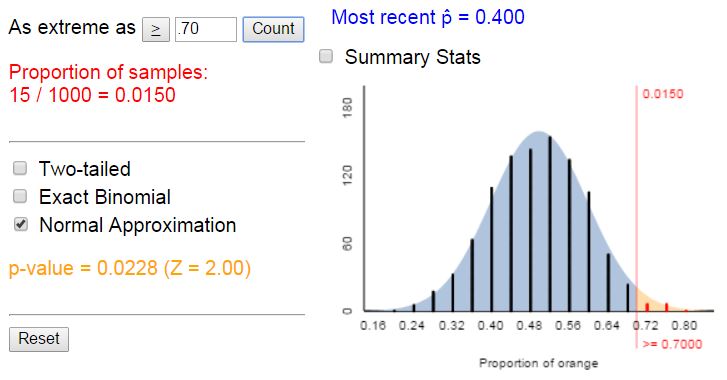
For a while I used the applets for achieving conceptual understanding and then moved to statistical software for the “real data analysis.” But more and more I’ve questioned whether that additional transition point is necessary. I want student to see simulation-based methods as equally legitimate to theory-based procedures, if not preferred in some situations. So now our approach in the applets is to allow students to “add on” a theoretical analysis, but the simulation-based is the main focus. For example, students can overlay the theoretical probability distribution and display the empirical and theoretical p-values simultaneously.
I do still think the question of how much students can design and implement their own simulations is a good one. I wish I had more time for students to be creating their own simulations, but I worry that would take time away from some later ideas I want them to get to in the introductory course. In my course for mathematics and statistics majors I do expect students to do a bit more with creating the simulations themselves (e.g., in R) and I think the ability to write an algorithm (pseudo-code) is a good skill to practice regardless of the choice of software tools.We are still exploring ways to make sure the applets don’t do so much that students don’t have to think for themselves. For example, originally the applets had students push a button to display the p-value. Now, students have to enter the observed value of the statistic themselves, as an in-between step to check their understanding of the process. But we don’t want to leave students completely on their own either, so we have the applet give a warning message if we don’t think they have entered the correct value based on the observed sample data they provided. So the applets do still provide more scaffolding and transparency than many statistical packages. When students do add (or proceed directly to) the theoretical analysis, the output looks just like a standard package, so we are hoping that transition and the ability to read generic output is maintained.
Another feature of the newer (javascript) applets is that we can program in the ability to pass certain settings into the applet URL, allowing for some customization. For example, the one proportion applet and new Reese’s Pieces applet are really the same, just depends on whether “candy=1” is passed into the URL. This greatly enhances the flexibility in the applets as they are used in different classes (e.g., an instructor could use use the symbol p instead of π) and we continue to appreciate the feedback we are getting on the applets and continue to make enhancements. If you’d like to leave feedback below on our suite of applets please do so!