 Tim Erickson, Mills College
Joan Garfield tells us that approaching inference using simulation is like teaching students to cook rather than simply to follow recipes. I’m totally on board with that. In this post, I want to reflect about students can also grow the vegetables—that is, become farmers as well as cooks—and build the simulations themselves. [pullquote]Yet I claim that making students responsible for the hard part is good for learning.[/pullquote]
There are pros and cons. I tried having high-school students be the “farmers” in two year-long, non-AP courses. Here’s an obvious observation: simulations for learning inference vary a lot in how hard they are for students to make. For this post, I’ll focus on what makes them hard.
We can rate difficulty-in-construction by how many “tables” your randomization machinery requires. By “table,” I mean a chunk of information you could organize in a coherent table with rows for cases and columns for variables. (In Fathom, this is a collection.)
A few examples will clarify what I mean.
One-table situations
It takes one table to explore the sums of two dice. Like this: make three columns, and many rows. Give the first two columns formulas such as
randomPick(1, 2, 3, 4, 5, 6) (or your system’s equivalent).
Make the third column the sum of the other two. Then study the distribution of sum; for example, see what fraction of the numbers are “5” to estimate P(5).
The formulas students write are no more complicated than in elementary Excel, except that they involve randomness. These one-table simulations are easy for students to construct, and they can do so using technology ranging from graphing calculators to full-fledged computers.
Two-table situations
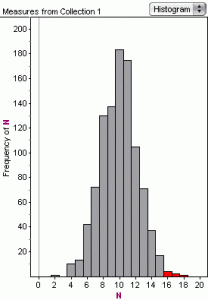
Suppose we want to know how likely it is to get sixteen or more heads in 20 flips of a coin? (This is what I call the “Aunt Belinda” problem; for more, see this post on my blog ). This is a two-table project.
Make one table with a single column of twenty rows; make it so each cell randomly holds “heads” or “tails.” Count the heads and re-randomize. Then, in another table, collect those counts as they appear. Do this a thousand times, and you have a sampling distribution of the frequency.
Count the number of times you get 16 or more heads—in this case, seven—and you have a p-value of 0.007.
Three-table situations
To demonstrate other sampling distributions, we might need three tables. The first is the population; the second is a sample; and the third a distribution of some sample statistic.
We can use same three-table structure for bootstrapping or for intergroup comparisons.
Although these situations are the hardest, my non-mathy high-schoolers mostly learned to handle them. By the end of the year, starting with a blank screen, they could compare the means of two populations. They started by putting their data in a table. Then they scrambled the group membership, creating a second table. They repeated that procedure many times, collecting intergroup differences in a sampling distribution (the third table). Finally, they saw where their test statistic fell in the resulting distribution, calculated a p-value, and drew sensible conclusions.
Any Advantage over Applets?
As complexity increases, so does the overhead in students’ learning to do this on their own. Applets and special-purpose software eliminate the multi-table-ness and let students focus directly on important concepts such as the sampling distribution. What added value do you get by making them learn Fathom’s “collect measures” mechanism, or Minitab macros, or whatever your technology requires? Here are four possible answers:
Unity. If students construct the simulations in the same environment in which they do their data analysis, then simulation and randomization are always at hand, and become part of the natural analysis process. Simulation is not something “for learning,” but something you can immediately use on your own data.
Flexibility. If you want to explore something a little different—suppose you want to study 13-sided dice or see the sampling distribution of the 90th percentile instead of the mean—you’re not restricted to the options the applet designer included.
Raw Constructivism. The moment you collect statistics in a different table, it gets hard: hard to learn the syntax or gestures you need in order to make the numbers go where they belong, and hard to understand the underlying mystery that is a sampling distribution. That may be a good reason to have an applet take care of it all. Yet I claim (without evidence but with enthusiasm) that making students responsible for the hard part is good for learning. They will understand and remember the process better, and connect it to other analogous processes.
Power. Every time a student enters her own formula into a computer, she is communicating using abstract, symbolic mathematics. The more she does this, the greater her understanding, and the greater her ability to use the technology to do whatever she wants.
The Take-Away
I encourage you to try having students construct their own simulations.
Start with the simplest one-table situations and see what happens. This blog post describes a two-dice-sum lesson I did. Because we were in our data analysis environment, we could “open up” this simple simulation, analyzing the byproducts of the simulation using the tools we used for everything else. We saw data and relationships that might have been hidden in an applet.
Whether constructing two- and three-table sims is appropriate depends, I think, on the technology you have available, your fluency with it, and your tolerance for confusion. Fathom is built for this, Fathom is currently free, and I’m a Fathom guy, so it was an easy choice for me. If your course requires actual programming (e.g., with R) then everything is possible—and you have no excuse. Good luck! Tell us how it goes!
