
 One of the biggest challenges we all face as teachers of statistics is testing students’ statistical knowledge. For example, how do we know if the assessment questions we write are assessing students’ understanding of the statistical material and not some irrelevant construct? How do we know how many questions should be on an assessment to truly see if students are “getting it?” But these questions are only the tip of the iceberg. I know we also grapple with finding interesting contexts and datasets for assessing a particular statistical method; It is hard and time consuming! I have often found an exciting example and dataset only to find that once I start digging into the data, it is beyond the level expected of my introductory statistics students (*Sigh…back to the drawing board). When I was asked to write this blog post, I thought it would be great to share an interesting question so that the task of assessment development isn’t so burdensome for others.[pullquote] I think it is important to note that I am not just asking them to conduct a randomization test, but am also asking them for interpretations and to think about how study design affects our conclusions. Asking them a multitude of questions for one context also saves me time for coming up with different contexts and reduces cognitive load for my students.[/pullquote]
The question I am sharing was written to test students’ understanding of randomization tests as well as some other basic statistical literacy topics (e.g., types of studies). Additionally, the question is based on a REAL experiment (with random assignment) and is something my students can relate to. I try to use real datasets whenever I can, which can be messy.
In the experiment, participants listened to a lecture and were tested on the material they learned. Some of the participants were seated in a location where they would be able to view other students surfing the web, and some participants were seated in a location where they could not easily view another student surfing the web. There was a fairly small sample size (19 in each treatment group) and it is possible the population data are skewed due to a ceiling effect common with test scores, so a traditional t-test would not be appropriate. If you are teaching t-tests in addition to randomization tests, this study provides the opportunity to add additional questions about why it would be more appropriate to conduct a randomization test than a t-test. I have also been known to give my students output to both the randomization test and t-test, ask them which method is more appropriate, and then to answer questions based on the method they chose.
When describing the context of the problem for any activity or test question, I try to pose an overarching research question. These descriptions tend to be fairly long, due to the messiness of real data. I then ask students multiple questions about different aspects of the study ending by having them answer the research question. I think it is important to note that I am not just asking them to conduct a randomization test, but am also asking them for interpretations and to think about how study design affects our conclusions. Asking them a multitude of questions for one context also saves me time for coming up with different contexts and reduces cognitive load for my students.
You may be wondering how long it takes to create a question such as the one I have shared here. To be honest, it does take some time. A majority of the time, maybe a couple of hours, is spent trying to find a context and data to use. For this particular experiment, I contacted the first author of the journal publication and was given access to the data within a couple of days. Unfortunately, many times, I cannot gain access to the real data in the time frame that I need it, so I simulate data based on statistics provided in the article. With practice, I promise it becomes easier to search and find new examples to use in test questions. Once you have your new contexts and data, the actual questions will be similar year to year.
Is it worth it to go through the effort to find real examples to use in test questions? I will end by saying yes, maybe they will learn something from taking the test, such as realizing that it is not respectful to their classmates to check Facebook during lecture!
Research Question: Do undergraduate students grades suffer when neighboring students use laptops during class?
An study[1] was conducted at a university with a sample of 38 volunteer undergraduate students (referred to as participants). The participants were randomly assigned a seat in a lecture hall and listened to a 45 minute lecture on meteorology. All participants were told they could not use laptops during the lecture, but they could take notes using pencil and paper.
Additional students (referred to as multitasking peers) were scattered throughout the classroom who did use laptops. These multitasking peers were told to pretend to take notes on a laptop as well as to browse the Internet and visit websites such as Facebook. Half of the participants were placed in seats where they were able to clearly view the laptops used by multitasking peers (group 1) and the other half of the participants were placed in seats where they were not able to clearly view the laptops used by the multitasking peers (group 2).
After the lecture, the multitasking peers left the room and the 38 participants completed a 30 minute multiple-choice test with 48 questions. The percent correct was reported for each participant. The average percent correct for the “in-view” treatment group (group 1) was 56% and the average percent correct for the “not-in-view” treatment group (group 2) was 73%.
- Is this an experimental study or an observational study? Explain.
- What is the statistic of interest? Describe it in words and provide a value.
- Based on your statistic alone, can we conclude that being in view of multitasking peers leads to a decrease in test scores?
A simulation for a randomization test was conducted to see if the average score for participants not in view (group 2) was significantly higher than participants in view (group 1). A randomization distribution for 1000 simulated randomization samples was created and plotted below.
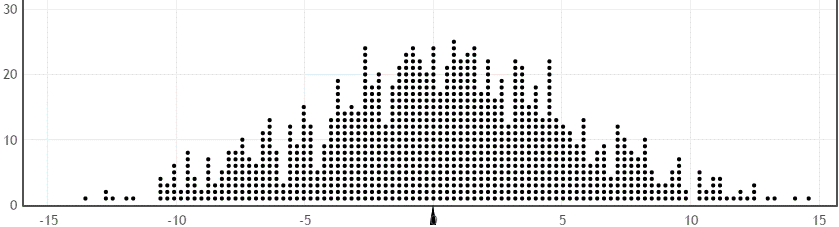
- What are the null and alternative hypotheses being tested?
- Why is the randomization distribution centered at 0?
- Provide an estimate of the p-value.
- Write a sentence interpreting your p-value.
- What would be the appropriate decision based on the randomization test?
- Provide an answer to the research question using the results and decision from your randomization test.
- Would it be appropriate to generalize these results to the population of all undergraduate students?
- Would it be appropriate to say that being in view of multitasking peers caused the mean score to be less than not being in view?
[1] Sana, F., Weston, T., & Cepeda, N. J. (2013). Laptop multitasking hinders classroom learning for both users and nearby peers. Computers & Education: 62, 24-31. doi: 10.1016/j.compedu.2012.10.003.