Chance News 102
Quotations
Forsooth
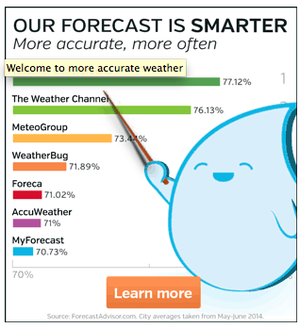
Alas, the graph is not smarter:

sidebar on Weather Underground forecast page, 19 October 2014
The nonzero baseline is an old trick for exaggerating comparisons, and examples are abundant. But it seems worse in the middle of a claim about of scientific accuracy!
Submitted by Bill Peterson
Ebola quanrantines
How to quarantine against Ebola
by Siddartha Mukherjee, New York Times, 12 October 2014
This op-ed piece dismisses several strategies for containing entry and spread of Ebola in the U.S. in favor of blood-sample screening based on multiplying any genes of the virus present via PCR (polymerase chain reaction).
Author Mukherjee (a professor of medicine at Columbia University) cites a false-positive rate of 3 per thousand and a false-negative rate of 4 per thousand.
Discussion
1. If an average of one person per planeload of 200 people has contracted the Ebola virus, what is the ratio of false positives to true positives in screening such planeloads?
2. If one in 1,000 people screened has the Ebola virus, what is the ratio of false positives to true positives?
3. If one in 10,000 people screened has the Ebola virus, what is the ratio of false positives to true positives?
4. Dr. Mukherjee cites a 2000 study in The Lancet of 24 "asymptomatic" individuals who had been exposed to Ebola. They were tested for the Ebola virus using an earlier version of the proposed screening test. Of the 24:
- 11 developed Ebola, 7 of whom had had positive tests;
- 13 did not develop Ebola, and none of them had tested positive.
From these data, how would you estimate the false-positive rate and false-negative s (with appropriate measures of uncertainty)? (The rates 3/1000 and 4/1000 cited above are for a later version of the method as refined in 2004.)
Submitted by Paul Campbell