Sandbox: Difference between revisions
Jump to navigation
Jump to search
| Line 1: | Line 1: | ||
== | ==Variability in employment figures== | ||
[http://www.nytimes.com/2014/05/02/upshot/how-not-to-be-misled-by-the-jobs-report.html?hp&target=comments#commentsContainer How not to be misled by the jobs report]<br> | |||
by Neil Irwin, New York Times, Upshot blog, 1 May 2014 | |||
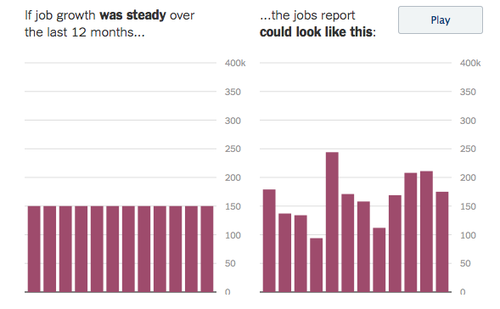
Much attention is paid to the Commerce Departments monthly report of the number of jobs added or lost by the US economy. But only rarely do reports in the popular press highlight the fact | |||
that these figures are based on survey data, and hence subject to sampling variability. | |||
Irwin's post here includes an animated simulation (screen capture show below) that indicates what 12 months of sample data might look like based on various assumptions about what the economy is really doing. | |||
<center>[[File:JobReportSim.png | 500px]]<center> | |||
Submitted by Bill Peterson | |||
Revision as of 17:41, 1 May 2014
Variability in employment figures
How not to be misled by the jobs report
by Neil Irwin, New York Times, Upshot blog, 1 May 2014
Much attention is paid to the Commerce Departments monthly report of the number of jobs added or lost by the US economy. But only rarely do reports in the popular press highlight the fact that these figures are based on survey data, and hence subject to sampling variability.
Irwin's post here includes an animated simulation (screen capture show below) that indicates what 12 months of sample data might look like based on various assumptions about what the economy is really doing.

Submitted by Bill Peterson