Chance News 95: Difference between revisions
| Line 8: | Line 8: | ||
==Forsooth== | ==Forsooth== | ||
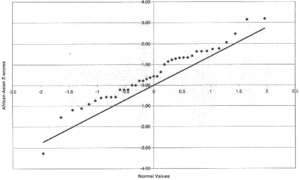
<center>[[File:TopTenWorstGraphs.png|300px]]</center> | <center>[[File:TopTenWorstGraphs.png|300px]]</center> | ||
<div align=center>“Figure 2. Q-Q plots of Z scores for telomeric interval-length differences.”</div> | <div align=center>“Figure 2. Q-Q plots of Z scores for telomeric interval-length differences.”</div> | ||
Cited at [http://www.biostat.wisc.edu/~kbroman/topten_worstgraphs/ “The top ten worst graphs”]<br> | |||
From [http://www.ncbi.nlm.nih.gov/pubmed/15627237?dopt=Abstract “Ethnicity and Human Genetic Linkage Maps”], <i>American Journal of Human Genetics</i>, February 2005<br> | |||
Submitted by Margaret Cibes | Submitted by Margaret Cibes | ||
Revision as of 14:17, 24 August 2013
Quotations
“It is worth dwelling for a moment on Egon [son of Karl] Pearson’s first-year lecture course …. [H]e was an inspirational teacher …. What was the reason for his success? [H]e was not a teacher who ladled out cookery-book recipes; rather he always seemed in his lectures to be working through and exploring problems with the class. He would wander down enticing dead-ends, but return to seek alternatives again and again until a satisfactory approach had been established. The result was that students acquired a questioning approach, not a compartmentalized approach whereby one problem was allocated to a 2 x 2 table, the next to multiple linear regression, etc.”
(1994 presidential address to the RSS)
Submitted by Margaret Cibes
Forsooth

Cited at “The top ten worst graphs”
From “Ethnicity and Human Genetic Linkage Maps”, American Journal of Human Genetics, February 2005
Submitted by Margaret Cibes