Chance News 90: Difference between revisions
| Line 286: | Line 286: | ||
On my list of curious cultural fads you learn about from your students: there is a genre of jokes known as "Chuck Norris Facts." Norris is a martial arts expert who gained TV and movie fame, and the jokes are over-the-top claims about his invincibility in all endeavors. For the uninitiated, [http://www.chucknorrisfacts.com/chuck-norris-favorite-facts here is a subcollection] allegedly picked by the man himself. | On my list of curious cultural fads you learn about from your students: there is a genre of jokes known as "Chuck Norris Facts." Norris is a martial arts expert who gained TV and movie fame, and the jokes are over-the-top claims about his invincibility in all endeavors. For the uninitiated, [http://www.chucknorrisfacts.com/chuck-norris-favorite-facts here is a subcollection] allegedly picked by the man himself. | ||
What does this have to do with statistics? Well, it seems that as Nate Silver's statistical models have entered the public imagination, a parallel collection of "Nate Silver facts" has emerged. Paul Alper sent the following, [http://www.reddit.com/r/IAmA/comments/166yeo/iama_blogger_for_fivethirtyeight_at_the_new_york/ | What does this have to do with statistics? Well, it seems that as Nate Silver's statistical models have entered the public imagination, a parallel collection of "Nate Silver facts" has emerged. Paul Alper sent the following examples, culled rom the social news site [http://www.reddit.com/r/IAmA/comments/166yeo/iama_blogger_for_fivethirtyeight_at_the_new_york/ Reddit’s “Ask Me Anything”] section. | ||
* Nate Silver sometimes has trouble falling asleep, because he already knows how many sheep there are. | * Nate Silver sometimes has trouble falling asleep, because he already knows how many sheep there are. | ||
* Results ask Nate Silver if they’re significant. | * Results ask Nate Silver if they’re significant. | ||
* Nate Silver expected the Spanish Inquisition. | * Nate Silver expected the Spanish Inquisition. | ||
Revision as of 20:30, 15 January 2013
Quotations
“Early on election day, in two tight, tucked-away rooms at Obama headquarters …, the campaign's data-crunching team awaited the nation's first results, from Dixville Notch, a New Hampshire hamlet that traditionally votes at midnight.
“Dixville Notch split 5-5. It did not seem an auspicious outcome for the president.
[But t]heir model had gotten it right, predicting that about 50% of the village's voters were likely to support President Obama. …. And as the night wore on, swing state after swing state came in with results that were very close to the model's prediction. ….
“To build the ‘support model,’ the campaign in 2011 made thousands of calls to voters — 5,000 to 10,000 in individual states, tens of thousands nationwide — to find out whether they backed the president. Then it analyzed what those voters had in common. More than 80 different pieces of information were factored in — including age, gender, voting history, home ownership and magazine subscriptions.”
Los Angeles Times, November 13, 2012
Submitted by Margaret Cibes
"Work. The best remedy for illness. One more reason why a person should never retire. The death rate among retired people is horrendous."
(It's not a Forsooth, because Garrison Keillor knows...)
Submitted by Jeanne Albert
“[Wharton School psychologist Uri] Simonsohn stressed that there’s a world of difference between data techniques that generate false positives, and fraud, but he said some academic psychologists have, until recently, been dangerously indifferent to both. .... Worse, sloppy statistics are “like steroids in baseball”: Throughout the affected fields, researchers who are too intellectually honest to use these tricks will publish less, and may perish. Meanwhile, the less fastidious flourish.
Submitted by Margaret Cibes
"The most exciting phrase to hear in science, the one that heralds new discoveries, is not Eureka! (I found it!) but rather, 'hmm... that's funny...'"
(For a bar chart of the frequency of Asimov’s publications over the period 1950-1995, see “Asimov’s Publications by Year”.)
Submitted by Margaret Cibes
Forsooth
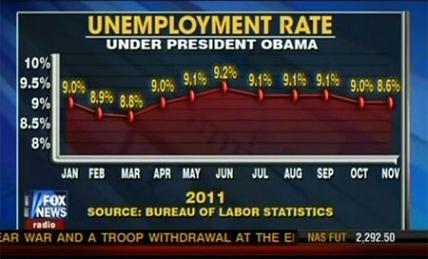
Look at the slope for changes of unemployment rate early in 2011 versus the change in slope for October to November.
Source: http://freethoughtblogs.com/lousycanuck/files/2011/12/121212_fox.jpg
This graphic is discussed at the [Freethought blogs] and at the [Simply Statistics blog]
Submitted by Steve Simon
“I wonder if when you [Nate Silver] get up in the morning you open your kitchen cabinet and go, I’m feeling 18.5% Rice Chex and 27.9% Frosted Mini-Wheats and 32% one of those whole-grain Kashi cereals .... And then I wonder if you think, But I’m really feeling 58.3% like having a cupcake for breakfast ....”
Submitted by Margaret Cibes
"[Vermont] State Tax Commissioner Mary Peterson advised legislative leaders in December that based on the statewide growth projected for school spending — an average 4.8 percent — the base tax rates for all properties would have to jump by a nickel per $100,000 of assessed value.
"A nickel increase on a home valued at $250,000 would add $125 to next year’s tax bill."
(Note: as of 8 January, the online version of the story has been corrected to read "a nickel per $100,000 of assessed value." Still: How did this get into a page 1 story intended to help folks understand their finances?)
Submitted by Priscilla Bremser
The signal and the noise
The big winner in the 2012 election was not Barack Obama. It was Nate Silver, the statistics wunderkind of the fivethirtyeight.com blog. Do not be surprised if he is Time Magazine’s 2012 Man (Person? Geek? Nerd?) of the Year. Just before the 2012 election took place this is what Stephen Colbert in his role as a right-wing megalomaniac mockingly said about Silver’s ability to predict election outcomes:
Yes. This race is razor tight. That means no margin for error, or correct use of metaphor. I mean, it's banana up for grabs. But folks, every prediction out there needs a pooper. In this case, New York Times polling Jedi Nate Silver, who in 2008 correctly predicted 49 out of 50 states. But, you know what they say. Even a stopped clock is right 98% of the time.
See, Silver's got a computer model that uses mumbo jumbo like "weighted polling average", "trendline adjustment", and "linear regression analysis", but ignores proven methodologies like flag-pin size, handshake strength, and intensity of debate glare.
While the gut feel of the “punditocracy” was certain the race would be very tight or that Romney would win in a landslide, Silver’s model based on his weighted averaging evaluation of the extensive polling, predicted the outcome (popular vote and electoral college vote) almost exactly. Here is a listing of what Silver and others predicted. The Washington Post had this description of Silver's achievement:
...I believe people are seriously misstating what Silver achieved. It isn’t that he predicted the election right where others botched it. It’s that he popularized a way of thinking about polling, a way to navigate through conflicting numbers and speculation, that would still have remained invaluable even if he’d predicted the outcome wrong.
Many liberals relied exclusively on Silver. But his model was only one of a number of polling trackers that were all worth consulting throughout — including Real Clear Politics, TPM, and HuffPollster — that were doing roughly the same thing: tracking averages of state polls.
The election results have triggered soul-searching among pollsters, particularly those who got it wrong. But the failure of some polls to get it right doesn’t tell us anything we didn’t know before the election. Silver’s approach — and that of other modelers — has always been based on the idea that individual polls will inevitably be wrong.
Silver’s accomplishment was to popularize tools enabling you to navigate the unavoidable reality that some individual polls will necessarily be off, thanks to methodology or chance. People keep saying Silver got it right because the polls did. But that’s not really true. The polling averages got it right.
Clearly, Silver never sleeps because all the while he was pumping out simulations of the presidential and US senate races, he published just before the election an amazing book, The Signal and the Noise: Why So Many Predictions Fail--but Some Don’t. The reviews are glowingly positive as befits his track record. For instance, as Noam Scheiber put it, “Nate Silver has lived a preposterously interesting life…It’s largely about evaluating predictions in a variety of fields, from finance to weather to epidemiology…Silver’s volume is more like an engagingly written user’s manual, with forays into topics like dynamic nonlinear systems (the guts of chaos theory) and Bayes’s theorem (a tool for figuring out how likely a particular hunch is right in light of the evidence we observe).”
See also this review of the the book by John Allen Paulos.
Discussion
1. The above quotation from Scheiber failed to mention some other fascinating statistical prediction topics in the book: chess, poker, politics, basketball, earthquakes, flu outbreaks, cancer detection, terrorism and of course, baseball--Silver’s first success story. By all means, read the book which is both scholarly (56 pages of end notes) and breezy. However, because the book is so USA oriented, it may well be opaque to anyone outside of North America.
2. The above link from the Washington Post has Silver claiming 332 electoral votes for Obama and 203 [misprint, should be 206] for Romney which turns out to be the exact result. However, on Silver’s blog itself, Obama gets only 313 electoral votes and Romney gets 225. Explain the discrepancy. Hint: Look at Silver’s prediction for Florida.
3. The above link from the Washington Post indicates that several other poll aggregators using similar methodology were just as accurate as Silver. Speculate as to why they are less celebrated?
4. Silver also predicted the outcome of the U.S. Senate races. In fact, while he got all the others right, he was quite wrong in one of them and spectacularly wrong in another. Which two were they? Speculate as to why Silver was less successful predicting the Senate races than he was on the presidential race.
5. Silver’s use of averaging to improve a forecast has a long history in statistics. There exists a famous example of Francis Galton of over 100 years ago:
In 1906, visiting a livestock fair, he stumbled upon an intriguing contest. An ox was on display, and the villagers were invited to guess the animal's weight after it was slaughtered and dressed. Nearly 800 participated, but not one person hit the exact mark: 1,198 pounds. Galton stated that "the middlemost estimate expresses the vox populi, every other estimate being condemned as too low or too high by a majority of the voters", and calculated this value (in modern terminology, the median) as 1,207 pounds. To his surprise, this was within 0.8% of the weight measured by the judges. Soon afterwards, he acknowledged that the mean of the guesses, at 1,197 pounds, was even more accurate.
Presumably, those 800 hundred villagers in 1906 knew something about oxen and pounds. Suppose Galton had asked the villagers to guess the number of chromosomes of the ox. Why in this case would averaging likely to be useless?
6. Suppose instead, Galton had asked the villagers to come up with a number for the (putatively) famous issue of the medieval era: “How many angels can dance on the head of a pin?” Why is this different from inquiring about the weight of an ox or its number of chromosomes?
7. Although Silver devotes many pages to the volatility of the stock market, he barely mentions (only in the footnote on page 368) Nassim Taleb and his “black swans.” Rather than black swans and fractals, Silver invokes the power-law distribution to explain “very occasional but very large swings up or down” in the stock market and the frequency of earthquakes. For more on the power-law distribution, see this interesting Wikipedia article.
8. One of the lessons of the book is that in order to predict a specific phenomenon successfully is that there needs to be a data rich environment. Therefore, ironically, weather forecasting is, so to speak, on much firmer ground than earthquake forecasting.
9. Another lesson of the book is that when it comes to the game of poker, now that most of the poor players have left the scene, it is easier to make money by owning the house than being a participant. Knowledge of Bayes theorem can only go so far.
Submitted by Paul Alper
Note
Readers might also like to view Nate Silver's two 5-minute appearances on Comedy Central's The Colbert Report, one on October 7, 2008[1] and the other on November 5, 2012[2].
Submitted by Margaret Cibes
Internal polls
When internal polls mislead, a whole campaign may be to blame
by Nate Silver, FiveThirtyEight blog, New York Times, 1 December 2012
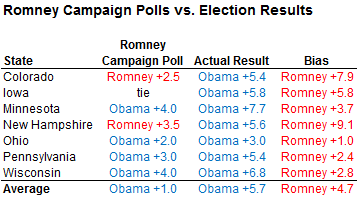
Silver presents the following chart that compares Romney internal polls with the actual results.
He relies on Noam Scheiber's article from the New Republic (30 November 2012), Exclusive: The internal polls that made Mitt Romney think he'd win.
Silver suggests, "Campaigns might consider how pollsters are compensated; they could tie some of the pollster’s compensation to the accuracy of its final polls, for instance. ...But most important, campaigns would be wise not to have their pollsters serve as public spokesmen or spin doctors for the campaign. Campaigns have other personnel who specialize in those tasks..."
In the same vein, Henry J. Enten concludes his lengthy article in the Guardian, Crunching the numbers shows how Obama and Romney were polls apart, with this statement: "Internal numbers that a campaign releases to the public should be thought of less as scientific surveys and more as talking points."
Submitted by Paul Alper
Clinical trials need to be adapted to the Mayan calendar
The Mayan Doomsday’s effect on survival outcomes in clinical trials Paul Whetley-Price, Brian Hutton, Mark Clemons. CMAJ December 11, 2012 vol. 184 no. 18 doi: 10.1503/cmaj.121616.
Will the world end when the Mayan calendar runs out on December 21, 2012? If so, we need to prepare.
Such an event would undoubtedly affect population survival and, thus, survival outcomes in clinical trials. Here, we discuss how the outcomes of clinical trials may be affected by the extinction of all mankind and recommend appropriate changes to their conduct.
This paper presents a Kaplan-Meier curve illustrating the effect of extinction of humankind, along with the gradual zombie repopulation.
The authors go on to note that extinction will likely mask any mortality difference between two arms of a clinical trial and that it will make the recording of adverse event data impossible.
Questions
1. If you are a member of a DSMB monitoring a clinical trial, and the world ends, would that be sufficient grounds for stopping the trial early, or would you continue the trial to the planned endpoint in order to preserve the Type I error rate?
2. Is death due to apocalypse considered an unexpected adverse event? If so, how quickly does it need to be reported?
Submitted by Steve Simon
Use of technology in instruction
“Interactive Learning Online at Public Universities: Evidence from Randomized Trials” (May 22, 2012) is a 50-page report about a formal statistical study of introductory statistics courses at 6 public universities. The control groups were enrolled in a traditional classroom course; the treatment groups were enrolled in a “hybrid course using a prototype machine-guided mode of instruction developed at Carnegie Mellon University in concert with one face-to-face meeting each week.” Lots of raw data is provided in tables and charts.
The study was designed to answer the following questions about interactive online courses: (1) Can they maintain – or improve – improve basic learning outcomes? (2) Are they as – or more – effective for students in particular socio-economic groups? (3) Are they equally effective for less prepared students as for well prepared students?
The authors conclude, “The results of this study are remarkable; they show comparable learning outcomes for this basic course, with a promise of cost savings and productivity gains over time. …. More research is needed.”
Two of the authors wrote an earlier report in which they review the research literature about interactive online learning, “Current Status of Research on Online Learning in Postsecondary Education” (May 18, 2012). They conclude, “The review yields little evidence to support broad claims that online or hybrid learning is significantly more effective or significantly less effective than courses taught in a face-to-face format. At the same time, it highlights the need for further research on this topic, with particular attention paid to differences in outcomes among different student populations and different sets of institutional users.”
On the other hand, see an unrelated website, Teaching Naked, where Jose Bowen offers a 22-minute video “Keynote Abstract”, explaining his advocacy for the use of technology outside of the classroom.
[T]he greatest value of a physical university will remain its face-to-face (naked) interaction between faculty and students. The most important benefits to using technology occur outside [Bowen’s emphasis] of the classroom. New technology can increase student preparation and engagement between classes and create more time for the in-class dialogue that makes the campus experience worth the extra money it will always cost to deliver. …. By rethinking our assignments, use of technology and course design, we can create more class time for the activities and interactions that most spark the critical thinking and change of mental models we seek.”
Chance readers can decide for themselves whether any of these pieces are relevant/worthwhile with respect to their experiences/opinions.
Submitted by Margaret Cibes
Suggestions for savvier statistical reports
“Statistical Habits to Add, or Subtract, in 2013”
“Tips for a Statistically Savvy 2013”
by Carl Bialik, The Wall Street Journal, December 28, 2012
Bialik solicited from statisticians and other readers their pet peeves about statistical data as these are reported to the public. He also noted that 2013 has been designated the International Year of Statistics.
One biostatistician stated, “The most important numerical fallacy is that people tend to think of numbers as known, constant and having no variability.”
Based on his feedback, Bialik offers advice:
(1) With respect to hasty conclusions, remember that things can look good from the standpoint of a small sample and/or in the short-term, but don’t ignore potential regression-to-the-mean effects.
(2) Pay attention to the context of a statistical result: note the difference between relative versus absolute changes, between observational versus experimental studies, and between the absence of evidence versus the evidence of absence.
(3) Realize that extremely unlikely events can occur, especially in very large populations.
Other readers commented on their pet peeves:
(a) rates “smoothed out to create arresting statistics,” such as “one murder every 10 minutes”;
(b) charts which distort information, such as not starting the y-axis at 0 when possible;
(c) lack of discussion of study design in medical research reports;
(d) confusion between correlation and causation.
One respondent urged consumers of statistical information not to underestimate the power of “simple computations.” He stated, “It’s amazing, even in our complex modern world, how many assertions fail simple ‘back of the envelope’ reasonable estimates with elementary computations.”
There are many more issues raised by bloggers to Bialik’s second article. They identify two of my pet peeves – “nonsense such as ‘A earns ten times less than B’" and misuse of “percent” for “percentage point.” There is also a good list of “rules of thumb” that one blogger has compiled for his graduate students.
Submitted by Margaret Cibes
Big data or big hype?
Sure, Big Data Is Great. But So Is Intuition. Steve Lohr, The New York Times, December 29, 2012.
There are lots of people who will tell you all the wonderful things that Big Data will bring us. A recent research conference started off with some glowing testimonials.
Andrew McAfee, principal research scientist at the M.I.T. Center for Digital Business, led off the conference by saying that Big Data would be “the next big chapter of our business history.” Next on stage was Erik Brynjolfsson, a professor and director of the M.I.T. center and a co-author of the article with Dr. McAfee. Big Data, said Professor Brynjolfsson, will “replace ideas, paradigms, organizations and ways of thinking about the world.” These drumroll claims rest on the premise that data like Web-browsing trails, sensor signals, GPS tracking, and social network messages will open the door to measuring and monitoring people and machines as never before. And by setting clever computer algorithms loose on the data troves, you can predict behavior of all kinds: shopping, dating and voting, for example. The results, according to technologists and business executives, will be a smarter world, with more efficient companies, better-served consumers and superior decisions guided by data and analysis.
Could it be possible though, that we are overhyping this a bit? Could there be some limits? It depends who you ask.
At the M.I.T. conference, a panel was asked to cite examples of big failures in Big Data. No one could really think of any. Soon after, though, Roberto Rigobon could barely contain himself as he took to the stage. Mr. Rigobon, a professor at M.I.T.’s Sloan School of Management, said that the financial crisis certainly humbled the data hounds. “Hedge funds failed all over the world,” he said.
Models can be wrong of course. But do the people who fit these models to large data sets really appreciate this?
Claudia Perlich, chief scientist at Media6Degrees, an online ad-targeting start-up in New York, puts the problem this way: “You can fool yourself with data like you can’t with anything else. I fear a Big Data bubble.”
Here's some sage advice.
Thomas H. Davenport, a visiting professor at the Harvard Business School, is writing a book called “Keeping Up With the Quants” to help managers cope with the Big Data challenge. A major part of managing Big Data projects, he says, is asking the right questions: How do you define the problem? What data do you need? Where does it come from? What are the assumptions behind the model that the data is fed into? How is the model different from reality?
The article goes on to discuss some of the ethical dimensions of big data models.
Questions
1. Thinks of some reasons why the panel of experts on big data could not come up with any examples of failures.
2. Is there something about models with big data that makes them more difficult to troubleshoot?
Submitted by Steve Simon
Ngrams
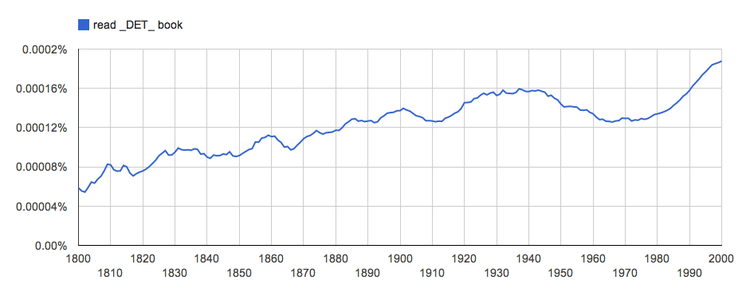
The 21st century belongs to Google. Not only Google Maps, Google Voice, Google Translate but also Google Ngrams.
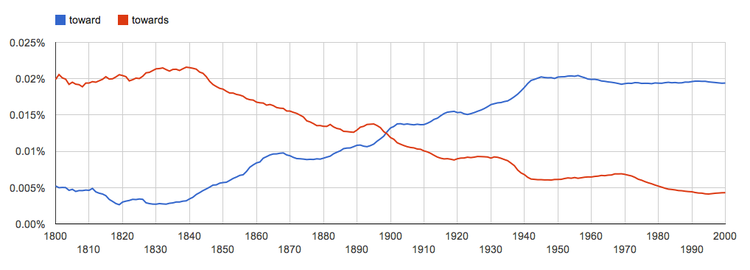
What does the Ngram Viewer do? When you enter phrases into the Google Books Ngram Viewer, it displays a graph showing how those phrases have occurred in a corpus of books (e.g., "British English", "English Fiction", "French") over the selected years.
For example, the graph below shows how in American English the word “toward” overtook the word “towards” in about 1898 and never looked back.
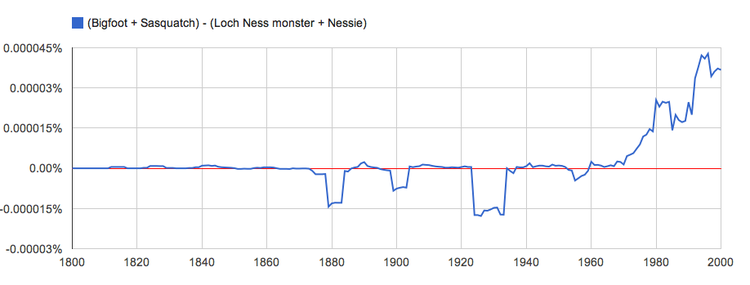
Ngram Viewer is very versatile and is not limited to one word versus another single word; with the proper “tags” and “operators” the most amazing comparisons can be made. For example, “Ngram subtraction gives you an easy way to compare one set of ngrams to another:”
As another example, “Since the part-of-speech tags needn't attach to particular words, you can use the DET tag to search for read a book, read the book, read that book, read this book, and so on as follows:”
You can see much more in the TED talk on Ngrams, entitled What we learned from 5 million books.
Discussion
1. Ngrams can be a lot of fun. But, Google is looking at books only and not magazines, blogs, ebooks, twitter, email and as yet undiscovered forms of writing which are gaining on books.
2. Google also makes mistakes. My wife’s has a cabin in Wisconsin and Google misnames the access road and situates the cabin incorrectly relative to her lakefront property. These errors have existed for years. Will Google correct the error or will it flex its muscles and demand the access road be renamed and the cabin moved?
3. Google Translate is a very handy tool but a blunt instrument nevertheless. To see this, use Google Translate to go from your English to the native language of a friend. Then, ask the friend how well Google Translate performed.
Submitted by Paul Alper
Tails, honestly?
“Ethics: Honesty Begins at Home”
by Daniel Akst, The Wall Street Journal, December 21, 2013
According to author Akst, researchers claim to have found that people are more likely to be honest at home than in the work place. The researchers’ results are said, correctly, to be based on experiments in which a random sample of Germans were phoned at home and asked to flip a coin one or more times, with the promise of a monetary reward based on how many coins landed tails.
The researchers had no way to know which of the 658 participants might be lying, but a result of around 50-50 would indicate honesty. In fact, 56% [55.6%] reported heads.
See "Truth-Telling: A Representative Assessment", by Abeler, Becker, and Falk, of the University of Bonn Institute for the Study of Labor, October 9, 2012. The researchers stated the result, “In the 1-coin treatment, the distribution of actual reports is very close to the truthful distribution ….”
Questions
1. What proportion of those sampled reported tails? What is the likelihood of getting that response in a random sample of 658 people, compared to the theoretical probability of 50% tails?
2. In a formal statistical sense, do you agree with the paper’s authors that the tails response was “very close to the truthful distribution”
3. Do you agree with the article’s author when he implies that the researchers have found people to be honest at home? If not, in which direction might they tend to be erring/lying? Is that surprising in view of the monetary reward?
Submitted by Margaret Cibes
The nonsense math effect
“The nonsense math effect”
by Kimmo Eriksson, Judgment and Decision Making, November 2012
This paper describes an online experiment by a Swedish researcher, in which he offered each of 200 post-grad students (self-identified) an opportunity to rate the quality of research of one of two studies, based on its abstract. Some evaluated an exactly reprinted version, and others evaluated a version that contained the following completely unrelated math statement.

The study’s author found:
The abstract that included the meaningless mathematics tended to be judged of higher quality [by students with degrees in humanities and social sciences]. However, this "nonsense math effect" was not found among participants with degrees in mathematics, science, technology or medicine.
The study’s author noted the difference between the Sokal affair, in which Sokal exposed the ridiculousness of analyzing physics with respect to contemporary humanities topics such as postmodernism and relativism, and this study, which provides an example of the tendency of non-technical readers to be overly impressed by mathematical symbols and remarks in papers. (Sokal's 1999 book, Fashionable Nonsense, is a great read, albeit somewhat dispiriting.)
Carl Bialik also reported about this study in his print column, “Don’t Let Math Pull the Wool Over Your Eyes” and in his online blog, “Awed by Equations”, both in The Wall Street Journal, January 4, 2013.
Bialik related some comments about the study design. One Stanford researcher objected to aggregating the humanities and social science respondents because she felt that
“[m]ost social scientists are far more quantitatively savvy than those in the humanities.” Sokal would like to see the experiment run with university professors, who are more likely to be article referees.
Submitted by Margaret Cibes
Comic relief: Nate Silver facts
On my list of curious cultural fads you learn about from your students: there is a genre of jokes known as "Chuck Norris Facts." Norris is a martial arts expert who gained TV and movie fame, and the jokes are over-the-top claims about his invincibility in all endeavors. For the uninitiated, here is a subcollection allegedly picked by the man himself.
What does this have to do with statistics? Well, it seems that as Nate Silver's statistical models have entered the public imagination, a parallel collection of "Nate Silver facts" has emerged. Paul Alper sent the following examples, culled rom the social news site Reddit’s “Ask Me Anything” section.
- Nate Silver sometimes has trouble falling asleep, because he already knows how many sheep there are.
- Results ask Nate Silver if they’re significant.
- Nate Silver expected the Spanish Inquisition.
