Chance News 113: Difference between revisions
| Line 13: | Line 13: | ||
"His [Pythagoras's] theorem, a part of Euclidean geometry taught in many high school math classes, states that the hypotenuse of a right triangle (the side opposite the right angle) equals the sum of the squares of the other two sides." | "His [Pythagoras's] theorem, a part of Euclidean geometry taught in many high school math classes, states that the hypotenuse of a right triangle (the side opposite the right angle) equals the sum of the squares of the other two sides." | ||
<div align=right> in : [http://fortune.com/2018/06/21/stonehenge-builders-used-pythagoras-theorem-centuries-before-birth-experts/ Stonehenge builders used Pythagoras' Theorem centuries before his birth, say experts], ''Fortune'', 21 June 2018.</div> | <div align=right> in : [http://fortune.com/2018/06/21/stonehenge-builders-used-pythagoras-theorem-centuries-before-birth-experts/ Stonehenge builders used Pythagoras' Theorem centuries before his birth, say experts], ''Fortune'', 21 June 2018.</div> | ||
Suggested by Bill Beckham (thanks to John Emerson for forwarding). | |||
==Statistic of last year== | ==Statistic of last year== | ||
Revision as of 15:12, 4 September 2018
January 1, 2018 to June 30, 2018
Quotations
“Scientists should be spending more time collecting good data and reporting their raw results for all to see and less time trying to come up with methods for extracting a spurious certainty out of noisy data.”
“The court will not rely on extrapolated numbers from tiny samples sizes and otherwise flawed data.”
Forsooth
"His [Pythagoras's] theorem, a part of Euclidean geometry taught in many high school math classes, states that the hypotenuse of a right triangle (the side opposite the right angle) equals the sum of the squares of the other two sides."
Suggested by Bill Beckham (thanks to John Emerson for forwarding).
Statistic of last year
On lawnmowers and terrorists again: the danger of using historical data alone for decision-making
by Norman Fenton, Probability and Law blog,
Fenton's post is based on his short article that criticizes the Royal Statistical Society's International Statistic of the Year (see last issue of Chance News).
Voting maps
A case for math, not ‘gobbledygook,’ in judging partisan voting maps
by Adam Liptak, New York Times, 15 January 2018
Chief Justice John Roberts famously said that proposed statistical measures of partisan gerrymandering struck him as "sociological gobbledygook." But in many cases it is impossible to avoid technical issues, and the Court needs to make informed decisions.
The article cites a report It’s a fact: Supreme Court errors aren’t hard to find (ProPublica, 17 Oct 2017), where we read
The review found an error in a landmark ruling, Shelby County v. Holder, which struck down part of the Voting Rights Act. Chief Justice John Roberts used erroneous data to make claims about comparable rates of voter registration among blacks and whites in six southern states. In another case, Justice Anthony Kennedy falsely claimed that DNA analysis can be used to identify individual suspects in criminal cases with perfect accuracy.
Gerrymandering in Pennsylvania
Michael Posner sent the following link to the Isolated Statisticians list.
- The geeks who put a stop to Pennsylvania's partisan gerrymandering
- by Issie Lapowsky, Wired, 20 February 2018
Approval rating distortion
Trump falsely claims his approval among black Americans has doubled
by Linda Qiu, New York Times, 17 January 2018
The fact-checking article helps readers unpack a surprising claim, that is allegedly based on actual polling data. Among other mistakes, it turns out that (1) in an apples-to-oranges scenario, recent polling data were compared to exit poll data from the 2016 election; and (2) approval percentages for males and females were simply averaged without accounting for the the gender breakdown among respondents.
Discussion
In a typical "How the Poll was Conducted" statement that accompanies NYT polls, we see statements like: "The combined results have been weighted to adjust for variation in the sample relating to geographic region, sex, race, Hispanic origin, marital status, age, education and (for landline households) the number of adults and number of phone lines." Why then the objection above to averaging male and female approval percentages, which would seem to reflect a 50-50 weighting?
More on exit poll problems
The 2016 exit polls led us to misinterpret the 2016 election
by Thomas Edsall, New York Times, 29 March 2018
Among Democratic voters, exit polls overestimated the number of college-educated whites and underestimated the number of working class whites.
Update: See also An examination of the 2016 electorate, based on validated voters from the Pew Research Center (9 August 2018).
Matching shirts!
Leading probability researchers confounded by three coworkers wearing same shirt color on same day
The Onion, 18 January 2018
A lovely spoof on coincidence stories. We read the following breathless quote from "researchers":
We at least have models for something like two people coming to work wearing the same shoes or both getting a haircut the day before, but this is the equivalent of lightning striking in the same place hundreds of times in a row. We’re going to have to go back to the drawing board on probability analysis entirely.
Football decision theory
Force overtime? Or go for the win?
by Jesse Walker, Jane L. Risen, Thomas Gilovich and Richard Thaler , New York Times, 27 February 2018
In the final minutes of a game, teams may be faced with the choice of making a 1-point kick to tie the game, or going for a 2-point conversion that would win. Going for the tie may seem safer, but is it the best strategy?
Misleading rape statistic
Lies, damned lies, and one very misleading statistic
by Amanda Taub, New York Times, 28 February 2018
What is the basis for a sensational news story alleging that 60,000 rapes were committed by United Nations aid workers over the last decade.
The Times contacted Andrew McLeod, a former UN official who extrapolated the startling statistic from a 2017 UN report that found 311 victims of sexual exploitation by peacekeepers over the preceding year. The article traces the reasoning behind McLeod's estimates, but continues
In Mr. MacLeod’s telling, he always intended his memo to be an advocacy statement rather than what he called “peer-reviewed” statistical analysis — essentially a way to say “here is a problem that is very large and very bad” (my phrase), with digits instead of words.
The problem is, that isn’t how journalists use statistics, or how the public consumes them.
The article cites the Parkland school shooting in February as another example where a reported number quickly went viral. After the incident, many news and social media outlets claimed that this was the 18th school shooting of 2018. In fact, as the Washington Post explains, No, there haven’t been 18 school shootings in 2018. That number is flat wrong.
Educational spending graph
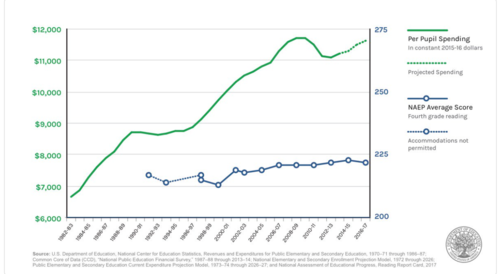
Why the school spending graph Betsy DeVos is sharing doesn’t mean what she says it does
By Matt Barnum, "Chalkbeat" blog, 13 April 2018
Critiques a double y-axis plot of NAEP test scores and per pupil spending, which Secretary of Education Betsy DeVos has been sharing on Twitter to argue the money is being wasted.
The blog post does a thorough job debunking her argument.
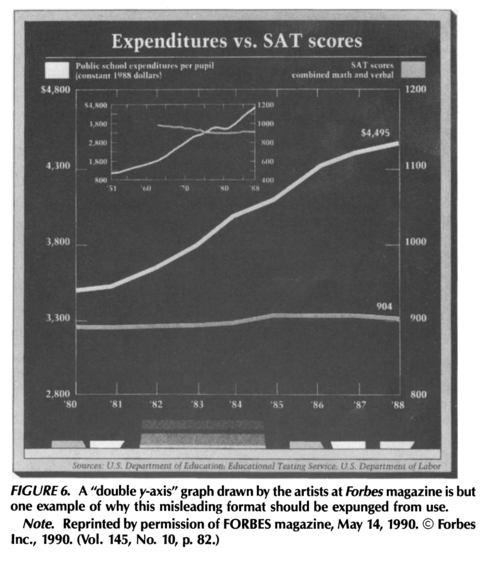
Plotting test scores vs. spending in this fashion is a long-time favorite trick of education critics. For example, in a 1992 paper, Howard Wainer discussed a strikingly similar example from Forbes magazine.
(The Forbes example also appears on p. 106 of his book Visual Revelations: Graphical Tales of Fate and Deception From Napoleon Bonaparte to Ross Perot).
For discussion of a more recent, egregious, double y-axis plot, see Bad graphic on Planned Parenthood from Chance News 107.
Lottery fraud stories
Jo Hardin sent the following article to the Isolated Statisticians e-mail list.
- The man who cracked the lottery
- by Reid Forgrave, New York Times Magazine, 3 May 2018
The article begins, "When the Iowa Attorney General's office began investigating and unclaimed lottery ticket worth millions, an incredible string of unlikely winners came to light--and a trail that pointed to an inside job."
Jeanne Albert sent a link to a Vermont story in a similar vein:
- More than luck? VTDigger investigates big wins on small games.
- by Katy Savage, VTDigger.org, 26 April 2018
Hurricane Maria death tolls
Why are the death tolls in Puerto Rico from Hurricane Maria so different?
by Sheri Fink, New York Times, 2 June 2018
Mediterranean diet study, revisited
That huge Mediterranean diet study was flawed. But was it wrong?
by Gina Kolata, New York Times, 13 June 2018
Subtitled: "A highly publicized trial in Spain found that the Mediterranean diet protects against heart disease. Now the original work has been retracted and re-analyzed, with the same result."
The new findings were also discussed on Andrew Gelman's blog About that quasi-retracted study on the Mediterranean diet . . . (15 June 2018), which cites this PLOS blogpost for more details.
Pew Research Center "Decoded"
Decoded is a new resource from the Pew Research Center. As described on the Welcome page:
Pew Research Center’s main website offers plenty in the way of polished reports, data visualizations and interactives. But there are also lots of methodological musings, puzzles and tangles that you would see if you could flip those picture-perfect research products over (metaphorically speaking)... At Decoded, you’ll find blog posts about some paths taken and some narrowly avoided, including experiments that intrigued us but never saw the light of day.
Among the intriguing technical tools you will find here are the following:

