Chance News 110: Difference between revisions
| Line 33: | Line 33: | ||
Peter notes that he got just over 82%. Here is his solution (using Mathematica): | Peter notes that he got just over 82%. Here is his solution (using Mathematica): | ||
: [[File:Doyle_marriage.png | 400px]] | |||
Revision as of 21:27, 14 June 2017
Quotations
Forsooth
What happened to the polls?
Why FiveThirtyEight gave Trump a better chance than almost anyone else
by Nate Silver, Fivethirtyeight.com, 11 November 2016
Putting the polling miss of the 2016 election in perspective
by Nate Cohn, Josh Katz and Kevin Quealy, 'TheUpshot' blog, New York Times, 13 November 2013
Statistical artifacts
Interracial marriage
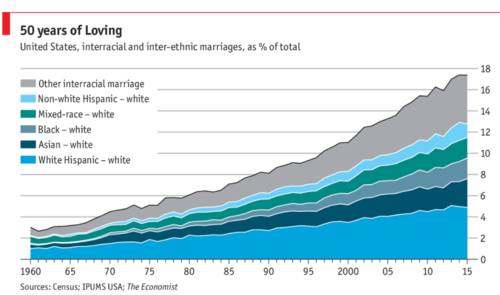
Peter Doyle sent a link to this chart from the Economist.
 ,
,Quoting from the article, one reader commented:
"Of the roughly 400,000 interracial weddings in 2015, 82% involved a white spouse, even though whites account for just 65% of America’s adult population. " If you lump the population into just two groups A and B, 100% of intergroup marriages will involve a spouse from group A, no matter what fraction of the population belongs to group A.
Exercise: 2015 census data is available by googling "us census quickfacts". While the categories don't precisely match those in this piece, you can use this data to get a rough estimate the fraction of interracial weddings that would involve a white spouse under random pairing. What do you get? Is your answer more or less than 82%?
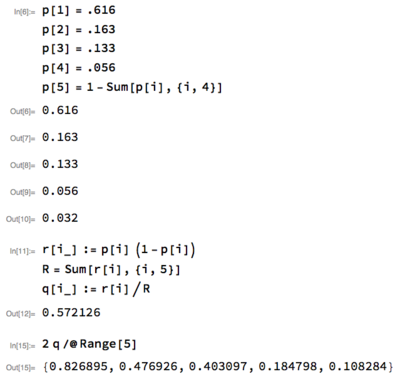
Peter notes that he got just over 82%. Here is his solution (using Mathematica):

