Chance News 106: Difference between revisions
| Line 299: | Line 299: | ||
Submitted by Paul Alper | Submitted by Paul Alper | ||
==Scoring standardized-test essays== | |||
[http://www.amazon.com/Making-Grades-Misadventures-Standardized-Industry/dp/098170915X <i>Making the Grades</i>, by Todd Farley, 2009<br> | |||
Todd Farley worked in the standardized-testing industry for 15 years, beginning while he was in grad school in Iowa in the mid-1990s. His book is subtitled “My Misadventures in the Standardized Testing Industry.” | |||
He describes the main issue for scorers as not “whether or not you appreciate or comprehend an essay” but rather “whether or not you can formulate exactly the same opinion about it as do all the people sitting around you.” And he describes one scoring scale as “flopp[ing] about like a puppy on a frozen pond.” | |||
Early on in his career, a table leader explained the “Mystery of High Reliability”: | |||
<blockquote>“It’s simple …. If I go into the system and see you gave a 0 to some student response and another scorer gave it a 1, I change one of the scores.” …. “The computer counts it as a disagreement only as long as the scores don’t match. Once I change one of the scores, the reliability number goes up.”<br> | |||
“The reliability numbers aren’t legit?” I asked.<br> | |||
“The reliability numbers are what we make them,” he said. ….<br> | |||
“Man,” I said, “I … thought we were in the business of <i>education</i>.” ….<br> | |||
“Maybe,” he said. “But I’d say we are in the <i>business</i> of education.”</blockquote> | |||
And later in his career, a trainer expressed concerned about the distribution of scores: | |||
<blockquote>“It seems we haven’t been scoring correctly.” …. “[O]ur numbers don’t match up with what the psychometricians predicted.” …. “They need us to find more 1’s.” </blockquoter> | |||
Farley’s reaction: “I assumed that if the psychometricians could tell, without actually looking at the student responses, there should be more 1’s, I figured there should be more 1’s.<br> | |||
Submitted by Margaret Cibes | |||
Revision as of 18:54, 14 September 2015
Quotations
“[A]ccording to preliminary 2014 statistics from the National Transportation Safety Board, there were no fatal accidents on U.S. commercial airline flights .... But 419 people died in general aviation crashes, a figure that inflates the average American’s odds of dying in a plane crash, even though most of us don’t travel in small, private planes.”
Submitted by Margaret Cibes
"The problem is not the inference in psychology it’s the psychology of inference. Some scientists have unreasonable expectations of replication of results and, unfortunately, many of those currently fingering p-values have no idea what a reasonable rate of replication should be."
StatsLife (Royal Statistical Society), 4 March 2015
Submitted by Bill Peterson
Two "Holmes" quotes
"It must be clearly recognized , however, that purely speculative ideas of this kind, specially invented to match the requirements, can have no scientific value until they acquire support from independent evidence."
"It is a capital mistake to theorise before one has data. Insensibly, one begins to twist facts to suit theories, instead of theories to suit facts."
Both quotations appear on page 453 of John Gribbin's book, The Scientists.
Submitted by Paul Alper
"Believing a theory is correct because someone reported p less than .05 in a Psychological Science paper is like believing that a player belongs in the Hall of Fame because hit .300 once in Fenway Park."
Submitted by Paul Alper
"Psychology studies also suffer from a certain limitation of the study population. Journalists who find themselves tempted to write 'studies show that people ...' should try replacing that phrase with 'studies show that small groups of affluent psychology majors ...' and see if they still want to write the article."
"Effectively, academia selects for outliers, and then we select for the outliers among the outliers, and then everyone's surprised that so many 'facts' about diet and human psychology turn out to be overstated, or just plain wrong."
Submitted by Paul Alper
Forsooth
You really are old as you feel
"Some of the subjects 'aged physiologically not at all [while] at the other extreme there were folks aging two to three times as much.'"
Submitted by Chris Andrews

See amazing comments here, as bloggers try to figure out the arithmetic.
Submitted by Margaret Cibes at the suggestion of Sarah Bedichek
“On another recent project for the energy modeler, the lighting system, with daylight responsive dimming and vacancy sensors, out-performed modeled performance by 100%.”
So--the actual lighting control system kept the lights off 100% of the time? Couldn’t they have achieved the same result at less cost by not installing the lights in the first place?
Submitted by Marc & Carolyn Hurwitz
Most Common Movie Title: Alice in Wonderland
1. Average IMDb Rating: 6.0376514
Most Common IMDb Rating: 7.2
Standard Deviation of IMDb Rating: 1.2209091978981308
2. Average Movie Length: 100 minutes
Most Common Movie Length: 90 minutes
Standard Deviation: 31.94308331064542
3. Average IMDb User Votes: 27,627
Most Common Number of User Votes: 5
Standard Deviation: 75824.97716775243 ....
5. Average Movie Year: 1984
Most Common Movie Year: 2004
Standard Deviation: 25.087728495416965
Submitted by Margaret Cibes at the suggestion of James Greenwood
“Saves 88% more water than a one-gallon urinal.”
We are not the first to notice. The image below
appears with commentary at What a urinal can teach us about statistics, "Armchair MBA" blog, 15 December 2014
Submitted by Bill Peterson

Submitted by Margaret Cibes

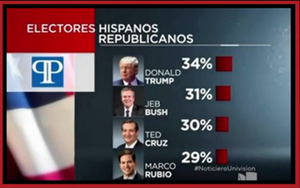
This was a handout at a Donald Trump rally, in which Trump claimed, “I’m #1 with Hispanics.”
Chris Hayes pointed out that the poll had asked about favorability, not support relative to the other candidates, and that 2/3 of the respondents regarded him unfavorably.
Hayes: “It’s a pretty novel interpretation of poll results.”
Submitted by Margaret Cibes
Followup on the hot hand
In Chance News 105, the last item was titled Does selection bias explain the hot hand?. It described how in their July 6 article, Miller and Sanjurjo assert that to determine the probability of a heads following a heads in a fixed sequence, you may calculate the proportion of times a head is followed by a head for each possible sequence and then compute the average proportion, giving each sequence an equal weighting on the grounds that each possible sequence is equally likely to occur. I agree that each possible sequence is equally likely to occur. But I assert that it is illegitimate to weight each sequence equally because some sequences have more chances for a head to follow a second head than others.
Let us assume, as Miller and Sanjurjo do, that we are considering the 14 possible sequences of four flips containing at least one head in the first three flips. A head is followed by another head in only one of the six sequences (see below) that contain only one head that could be followed by another, making the probability of a head being followed by another 1/6 for this set of six sequences.
TTHT Heads follows heads 0 time THTT Heads follows heads 0 times HTTT Heads follows heads 0 times TTHH Heads follows heads 1 time THTH Heads follows heads 0 times HTTH Heads follows heads 0 times
A head is followed by another head six out of 12 times in the six sequences (see below) that contain two heads that could be followed by another head, making the probability of a head being followed by another 6/12 = 1/2 for this set of six sequences.
THHT Heads follows heads 1 time HTHT Heads follows heads 0 times HHTT Heads follows heads 1 time THHH Heads follows heads 2 times HTHH Heads follows heads 1 time HHTH Heads follows heads 1 time
A head is followed by another head five out of six times in the two sequences (see below) that contain three heads that could be followed by another head, making the probability of a head being followed by another 5/6 this set of two sequences.
HHHT Heads follows heads 2 times HHHH Heads follows heads 3 times
An unweighted average of the 14 sequences gives
- [(6 × 1/6) + (6 × 1/2) + (2 × 5/6)] / 14 = [17/3] / 14 = 0.405,
which is what Miller and Sanjurjo report. A weighted average of the 14 sequences gives
- [(1)(6 × 1/6) + (2)(6 × 1/2) + (3)(2 × 5/6)] / [(1×6) + (2 × 6) + (3 × 2)]
- = [1 + 6 + 5] / [6 + 12 + 6] = 12/24 = 0.50.
Using an unweighted average instead of a weighted average is the pattern of reasoning underlying the statistical artifact known as Simpson’s paradox. And as is the case with Simpson’s paradox, it leads to faulty conclusions about how the world works.
Submitted by Jeff Eiseman, University of Massachusetts
Predicting GOP debate participants
Ethan Brown posted this following link on the Isolated Statisticians list:
- The first G.O.P. debate: Who’s in, who’s out and the role of chance
- by Kevin Quealy and Amanda Cox , "Upshot" blog New York Times, 21 July 2015
Because of the large number of declared candidates (16 and growing at the time of the article), Fox News has limited participation in its August 6 debate to those who meet the following criterion
Must place in the top 10 of an average of the five most recent national polls, as recognized by FOX News leading up to August 4th at 5 PM/ET. Such polling must be conducted by major, nationally recognized organizations that use standard methodological techniques.
But of course, polls are subject to sampling error. The NYT article uses simulation to illustrate how this could affect participation. Supposing the latest polling averages represent the "correct" values, they simulate 5 additional polls (as Ethan noted, this is a bootstrapping approach). The results demonstrate that this can affect who's in and who's out, as well as the location on the stage for those who do make the cut.
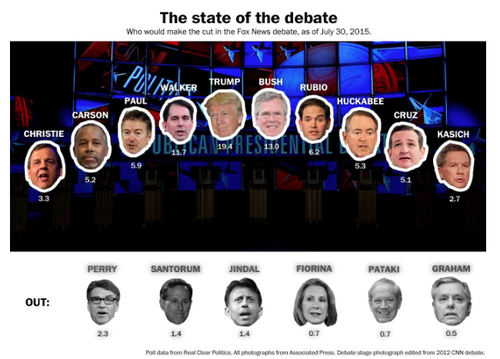
The Washington Post maintains a State of the debate widget that updates the current top 10 based on the most recent polling results. For July 30 we see

Note that the top figure is not a bar chart; it represents the positions of the candidates on the stage.
Updates
Who gets into the Republican debate: Rounding could decide
by Kevin Quealy, "Upshot" blog, New York Times, 3 August 2015
The article points out that Fox has not specified if or how it will round the polling figures. For example, the 9th, 10th and 11th places as of July 30 (shown in the display above) were Chris Christie (3.3%), John Kasich (2.7%) and Rick Perry (2.3%). These are all within a one percentage point range, but Christie and Kasich currently in in the top 10, but not Perry. More recent data presented in the present article have Christie and Kasich at 3.8% and Perry at 2.8%, a tie figures are rounded to 3%.

Quealy wonders if Fox might then consider having 11 debaters?
Final update: The NYT reported on August 4 that John Kasich is in, Rick Perry Is out in first Republican debate. The article quotes a statement from Fox News:
Each poll has a different margin of error, and averaging requires a distinct test of statistical significance. Given the over 2,400 interviews contained within the five polls, from a purely statistical perspective it is at least 90 percent likely that the 10th place Kasich is ahead of the 11th place Perry.”
Discussion
How do you think Fox arrived at their "90 percent likely" statement?
Evaluating health studies
We all know that as general as statistics is, particular subject matter knowledge and familiarity are all important. Here is a useful link for understanding and critically evaluating health news:
- NPR’s On the Media with a skeptic’s guide to health news/diet fads
- by Gary Schwitzer, HealthNewsReviews.org, 31 July 2015
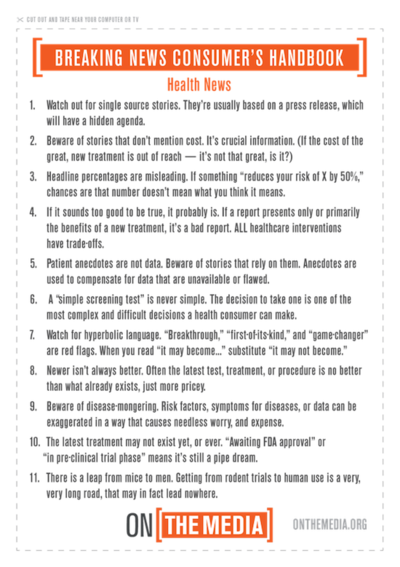
From which we find a consumer’s handbook for evaluating a health study:

The On the Media web site also contains a lengthy radio interview dealing with most of the above items.
See also:
- How to Know Whether to Believe a Health Study
- by Austin Frakt, "Upshot" blog, New York Times, 17 August 2015
One of the links there is the another handbook Covering Medical Research written for journalists by Gary Schwitzer.
Discussion
- Although Healthnewsreview.org has often mentioned this in the past, somehow the above consumer’s handbook failed to list “surrogate criterion” as a pitfall. Search Chance News and elsewhere to see why it belongs in a consumer’s handbook.
- Number 3 on the above list, risk reduction, depends on what is the denominator of a fraction. It is often unclear as to whether relative risk or absolute risk is being quoted. That is, the comparison might be to a/b or to (a/c) / (b/d) with all numbers positive and c > a and d > b. With this in mind, show that while Bill Gates gives more absolutely to charity than you do, nevertheless you give more relatively than he does. Relate this to risk reduction.
- Number 6 criticizes the notion of a “simple screening test.” Go to Screening (medicine) (Wikipedia) and its subsection, Limitations of screening to see why a simple screening test may be dangerous to your health.
- For a discussion of Number 9, see Disease mongering (Wikipedia) and The fight against disease mongering (PLoS Medicine).
- Relative risk vs. absolute risk and survival rates can be trickier than one might imagine at first glance. For an entertaining and informative discussion on how easy it is to be mislead, see Dr. Gilbert Welch's video presentation entitled, "The Two Most Misleading Numbers in Medicine."
Submitted by Paul Alper
Cautions on hypothesis testing
Scientific method: Statistical errors
by Regina Nuzzo, Nature News, 12 February 2014
The subtitle is "P values, the 'gold standard' of statistical validity, are not as reliable as many scientists assume." We read:
P values have always had critics. In their almost nine decades of existence, they have been likened to mosquitoes (annoying and impossible to swat away), the emperor's new clothes (fraught with obvious problems that everyone ignores) and the tool of a “sterile intellectual rake” who ravishes science but leaves it with no progeny[1]. One researcher suggested rechristening the methodology “statistical hypothesis inference testing”[2], presumably for the acronym it would yield.
Later on we have:
But while the rivals feuded — Neyman called some of Fisher's work mathematically “worse than useless”; Fisher called Neyman's approach “childish” and “horrifying [for] intellectual freedom in the west” — other researchers lost patience and began to write statistics manuals for working scientists. And because many of the authors were non-statisticians without a thorough understanding of either approach, they created a hybrid system that crammed Fisher's easy-to-calculate P value into Neyman and Pearson's reassuringly rigorous rule-based system. This is when a P value of 0.05 became enshrined as 'statistically significant', for example. “The P value was never meant to be used the way it's used today,” says [Steven] Goodman.
I have always bemoaned the conflation of exploratory and confirmatory:
Such practices have the effect of turning discoveries from exploratory studies — which should be treated with scepticism — into what look like sound confirmations but vanish on replication.
Submitted by Paul Alper
Note. For more on these ideas from Nature, see the Special Issue of entitled Challenges in irreproducible research.
More on reproducibility
Jeff Witmer sent the following link to the Isolated Statisticians list: Estimating the reproducibility of psychological science, from Science, 28 August 2015. As Jeff noted, a number of interesting graphs and tables accompany the article. For teaching purposes, the site includes a link to a Powerpoint slide for a key summary plot of original study effect size versus replication effect size.
Our quotations section above includes a number of items related to reproducibility. From the Conclusions section of the Science abstract we have the following:
Reproducibility is not well understood because the incentives for individual scientists prioritize novelty over replication. Innovation is the engine of discovery and is vital for a productive, effective scientific enterprise. However, innovative ideas become old news fast. Journal reviewers and editors may dismiss a new test of a published idea as unoriginal. The claim that “we already know this” belies the uncertainty of scientific evidence. Innovation points out paths that are possible; replication points out paths that are likely; progress relies on both.
Help for the aging brain?
Omega-3 supplements and exercise have no protective effect on the aging brain, studies find
by Susan Perry, Minneapolis Post, 26 August 2015
Reporting on the results of two randomized trials published in JAMA, Perry writes, "Neither exercise nor omega-3 supplements has a protective effect on the brains of older adults, according to the results of two large randomized controlled studies published Tuesday [August 25, 2015] in JAMA." The details of the two studies may be found (behind a pay wall) at
- Effect of omega-3 fatty acids, lutein/zeaxanthin, or other nutrient supplementation on cognitive function
- Effect of a 24-month physical activity intervention vs health education on cognitive outcomes in sedentary older adults
For the omega-3 study, Perry points out that
Half of the [approximately 3500] participants were given supplements with omega-3, a fatty acid found most abundantly in fish, but also in flaxseed, walnuts, soy products and a few other plant sources. The other half took a placebo. All had their cognitive skills tested before the study started and then twice more, at two-year intervals. At the end of five years, no difference in cognitive abilities was found between the groups.
With regard to the exercise study, she reports that
After two years, the [1635] participants’ cognitive function was assessed through a series of tests. No significant differences in scores were found between the two groups [exercise or health education].
Perry asks,
Do these results mean that exercising and eating nutrient-rich healthful foods (not supplements) is a waste of time and effort for older adults?”
She concludes,
Absolutely not, as the authors of a JAMA editorial that accompanies the studies stress. While these two studies "failed to demonstrate significant cognitive benefits, these results should not lead to nihilism involving lifestyle factors in older adults," they write.
Discussion
- For what it is worth, the nutrient study (omega-3 and other supplements) reported p-values of .66 and .63 regarding the difference between treatment and control. What sort of reaction follows from those numbers?
- For what it is worth, the exercise study (of several different cognitive tests) reported p-values of .97 and .84 regarding the difference between treatment and control. Again, what sort of reaction follows from those numbers?
- The studies mentioned in JAMA involved elderly people who presumably by virtue of age have already declined. The editorial asserts, “It is likely the biggest gains in reducing the overall burden of dementia will be achieved through policy and public health initiatives promoting primary prevention of cognitive decline rather than efforts directed toward individuals who have already developed significant cognitive deficits.” The editorial lauds life-long adherence to the so-called Mediterranean Diet as a way of staying mentally and physically healthy. For a more caustic look at the Mediterranean Diet see this discussion from Chance News 92.
Submitted by Paul Alper
Scoring standardized-test essays
[http://www.amazon.com/Making-Grades-Misadventures-Standardized-Industry/dp/098170915X Making the Grades, by Todd Farley, 2009
Todd Farley worked in the standardized-testing industry for 15 years, beginning while he was in grad school in Iowa in the mid-1990s. His book is subtitled “My Misadventures in the Standardized Testing Industry.”
He describes the main issue for scorers as not “whether or not you appreciate or comprehend an essay” but rather “whether or not you can formulate exactly the same opinion about it as do all the people sitting around you.” And he describes one scoring scale as “flopp[ing] about like a puppy on a frozen pond.”
Early on in his career, a table leader explained the “Mystery of High Reliability”:
“It’s simple …. If I go into the system and see you gave a 0 to some student response and another scorer gave it a 1, I change one of the scores.” …. “The computer counts it as a disagreement only as long as the scores don’t match. Once I change one of the scores, the reliability number goes up.”
“The reliability numbers aren’t legit?” I asked.
“The reliability numbers are what we make them,” he said. ….
“Man,” I said, “I … thought we were in the business of education.” ….
“Maybe,” he said. “But I’d say we are in the business of education.”
And later in his career, a trainer expressed concerned about the distribution of scores:
“It seems we haven’t been scoring correctly.” …. “[O]ur numbers don’t match up with what the psychometricians predicted.” …. “They need us to find more 1’s.” </blockquoter>
Farley’s reaction: “I assumed that if the psychometricians could tell, without actually looking at the student responses, there should be more 1’s, I figured there should be more 1’s.
Submitted by Margaret Cibes
