Sandbox: Difference between revisions
Jump to navigation
Jump to search
| Line 4: | Line 4: | ||
This post gives 40 remarkable data maps. They are a sequel to | This post gives 40 remarkable data maps. They are a sequel to | ||
Fisher's original 40 maps (posted August 12, 2013) [http://www.washingtonpost.com/blogs/worldviews/wp/2013/08/12/40-maps-that-explain-the-world/?lines here]. | Fisher's original 40 maps (posted August 12, 2013) [http://www.washingtonpost.com/blogs/worldviews/wp/2013/08/12/40-maps-that-explain-the-world/?lines here]. Each map is accompanied by some discussion, and links to the original data. | ||
<center>[[File:Nobels-by-region2.jpg | 500px]]</center> | <center>[[File:Nobels-by-region2.jpg | 500px]]</center> | ||
| Line 17: | Line 13: | ||
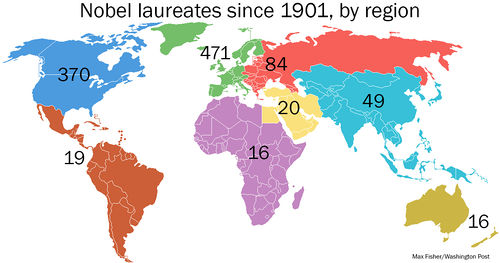
Fisher has further discussion of these data at [http://www.washingtonpost.com/blogs/worldviews/wp/2013/10/15/the-amazing-history-of-the-nobel-prize-told-in-maps-and-charts/ The amazing history of the Nobel Prize, told in maps and charts] (15 October 2013). | Fisher has further discussion of these data at [http://www.washingtonpost.com/blogs/worldviews/wp/2013/10/15/the-amazing-history-of-the-nobel-prize-told-in-maps-and-charts/ The amazing history of the Nobel Prize, told in maps and charts] (15 October 2013). | ||
Submitted by Paul Alper | Submitted by Paul Alper | ||
Revision as of 21:30, 24 January 2014
Maps that explain the world
40 more maps that explain the world
by Max Fisher, Washington Post, WorldViews blog, 13 January 2014
This post gives 40 remarkable data maps. They are a sequel to Fisher's original 40 maps (posted August 12, 2013) here. Each map is accompanied by some discussion, and links to the original data.

Discussion
Fisher writes, "Maps can be a remarkably powerful tool for understanding the world and how it works, but they show only what you ask them to." What does the Nobel map show? What other questions occur to you that it does not answer?
Fisher has further discussion of these data at The amazing history of the Nobel Prize, told in maps and charts (15 October 2013).
Submitted by Paul Alper