Chance News 96: Difference between revisions
| Line 37: | Line 37: | ||
<center>[[File:Monty_hall.png | 400px]]</center> | <center>[[File:Monty_hall.png | 400px]]</center> | ||
The Monty Hall problem just won't stay solved, so it was only a matter of time before it was enshrined in XKCD. Here | The Monty Hall problem just won't stay solved, so it was only a matter of time before it was enshrined in XKCD. Here are two other recent appearances in the news: | ||
:[http://www.bbc.co.uk/news/magazine-24047377 Stick or switch? Probability and the Monty Hall problem], ''BBC News Magazine'', 11 September 2013 | :[http://www.bbc.co.uk/news/magazine-24047377 Stick or switch? Probability and the Monty Hall problem], ''BBC News Magazine'', 11 September 2013 | ||
Revision as of 19:08, 16 November 2013
Quotations
"The world is a messy place. The scientific method imposes some order, but in the case of climate change, that order is probabilistic. For the sake of science and the planet, we should not become distracted by a false sense of certitude. Imprecise truths are the most inconvenient ones."
Submitted by Bill Peterson
I am particularly fond of this example [the Linda problem] because I know that the [conjoint] statement is least probable, yet a little homunculus in my head continues to jump up and down, shouting at me—"but she can’t just be a bank teller; read the description.”
[See the post on the Linda Problem below]
Submitted by Bill Peterson
Forsooth
From Statistics and Public Policy (1997)
“A somewhat comic, though not necessarily typical reaction to the use of sampling by a Federal agency occurred in 1936 when the National Resources Planning Board published its report Consumer Incomes in the United States, …. It showed a highly skewed distribution of income, with the top 10 per cent of the families and single individuals receiving 36 per cent of the income. …. [T]his was the first time that a Federal agency had published such data, and it was based on a sample. The U.S. Chamber of Commerce issued a blast against this report, which it considered it to be socialistic propaganda. It said that the estimates were based on ‘less than a 1 per cent sample, and a random sample at that!’”
cited by W. Allen Wallis, “Statistics in Washington, 1935-1945”
“Once managers start asking themselves ‘what is this distribution?’ instead of ‘what is this number?’, they are in a position to use the various tools … for their own analysis. …. What is needed is a convenient way to pass distributions around ….”
Submitted by Margaret Cibes
“The name MongoDB stems from ‘humongous database’, but chair and co-founder Dwight Merriman says there are more sizes and shapes to data than just ‘big’.”
Siliconrepublic, October 30, 2013
Submitted by Margaret Cibes
Let's make an XKCD
Thanks to Brian Abend for sending a link to this cartoon from XKCD

The Monty Hall problem just won't stay solved, so it was only a matter of time before it was enshrined in XKCD. Here are two other recent appearances in the news:
- Stick or switch? Probability and the Monty Hall problem, BBC News Magazine, 11 September 2013
- “Readers’ Challenge report: The Monty Hall problem,” Significance, October 2013 (only available online by electronic subscription)
Corrupt Ivy League admissions?
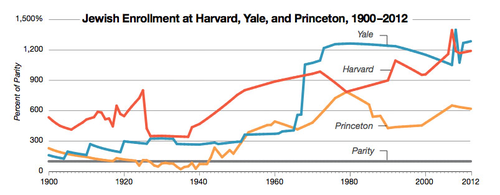
Writing last year, in the American Conservative (The myth of American meritocracy: How corrupt are Ivy League admissions?, 28 November 2012) Rob Unz claimed that today's Asian students were now being discriminated against in ways that Jewish students had been in the past. Namely, despite growing numbers in the population and impressive academic accomplishments, their share of the admissions to top institutions was being restricted by quotas. Furthermore, Unz went on to assert that Jewish students are now actually over-represented relative to equally qualified Asians and non-Jewish whites. Unz's article includes various statistical graphics to support these claims; for example, see

At the time of the article, a blog post by Andrew Gelman took the analysis at face value and asked, Should Harvard start admitting kids at random? (28 November 2012). Subsequently, however, Gelman and others were led to re-examine the Unz data, and found that many of the earlier claims do not stand up. For example, instead of inferring Jewishness via a family name, Janet Mertz actually contacted some of the individuals who were on the Math Olympiad team. She writes here that
The actual count of Jews is at least 10¼ out of 78 (counting part-Jews fractionally), i.e., 5-fold higher [than Unz's claim of only two ]. When an author refuses to admit to an error about which there is no possibility he is correct, academics have no choice but to then question the validity of everything that author has ever written because they can no longer trust the veracity of his statements.
Most recently, in a post entitled Ivy Jew update (22 October 2013), Gelman quotes Nurit Baytch:
Unz’s conclusion that Jews are over-admitted to Harvard was erroneous, as he relied on faulty assumptions and spurious data: Unz substantially overestimated the percentage of Jews at Harvard while grossly underestimating the percentage of Jews among high academic achievers.
This latest post by Gelman has a number of interesting quotations, that are worth bearing in mind when looking at any statistical claim:
- "My take on all this is that it can be harder than it looks to do research using statistics."
- "It’s perfectly natural to get excited when one’s initial hypothesis is confirmed by an examination of some data, but the next step is to recognize that these exciting discoveries do not always hold up."
Regarding the particular analysis in question, he writes
Unz, who spends so much of his time in the political arena, is used to politically-motivated criticisms and responds in kind, and so I think he sees the statistics provided by Mertz and Baytch as attacks to be dodged or parried rather than as useful information that can help him modify his understanding of the world. But for those of us how are not so invested in a particular position, Baytch’s article, and Mertz’s from a few months ago, should be helpful to anyone interested in further study of ethnicity and high-end college admissions.
In a related post, My beef with Brooks: the alternative to “good statistics” is not “no statistics,” it’s “bad statistics” (20 February 2013), Gelman takes columnist David Brooks to task for adopting an "anti-data" posture in a NYT column. He observes that Brooks had previously been happy to quote the Unz analysis in a column two months earlier. According to Gelman, "Janet Mertz contacted him and the Times to report that his published numbers were in error, and I also contacted Brooks (both directly and through an intermediary). But no correction has appeared."
Submitted by Paul Alper
Dance of the p-values
Paul Alper sent a link to a wonderful YouTube video, Dance of the p-values. This is an animated simulation--with sound effects keyed to emotional responses--designed to show how erratically the p-value can vary in replications of the same experiment.
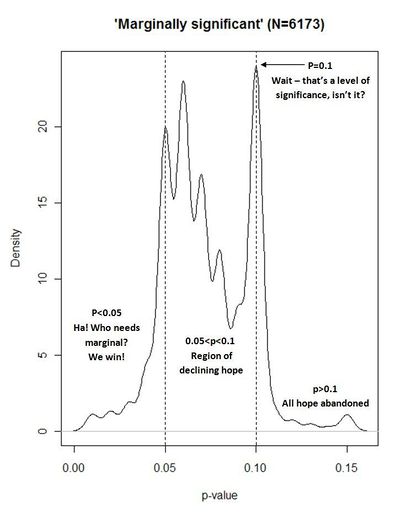
Paul found it through Andrew Gelman's blog (7 November) which also features this cartoon:
