Chance News 95: Difference between revisions
| Line 11: | Line 11: | ||
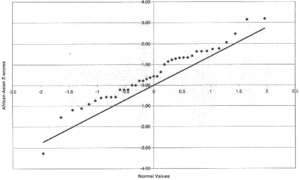
<div align=center>“Figure 2. Q-Q plots of Z scores for telomeric interval-length differences.”</div> | <div align=center>“Figure 2. Q-Q plots of Z scores for telomeric interval-length differences.”</div> | ||
<div align=right>Cited | <div align=right>Cited as #8 of [http://www.biostat.wisc.edu/~kbroman/topten_worstgraphs/ “The top ten worst graphs”]<br> | ||
from [http://www.ncbi.nlm.nih.gov/pubmed/15627237?dopt=Abstract “Ethnicity and Human Genetic Linkage Maps”],<br> | from [http://www.ncbi.nlm.nih.gov/pubmed/15627237?dopt=Abstract “Ethnicity and Human Genetic Linkage Maps”],<br> | ||
<i>American Journal of Human Genetics</i>, February 2005</div> | <i>American Journal of Human Genetics</i>, February 2005</div> | ||
Revision as of 14:20, 24 August 2013
Quotations
“It is worth dwelling for a moment on Egon [son of Karl] Pearson’s first-year lecture course …. [H]e was an inspirational teacher …. What was the reason for his success? [H]e was not a teacher who ladled out cookery-book recipes; rather he always seemed in his lectures to be working through and exploring problems with the class. He would wander down enticing dead-ends, but return to seek alternatives again and again until a satisfactory approach had been established. The result was that students acquired a questioning approach, not a compartmentalized approach whereby one problem was allocated to a 2 x 2 table, the next to multiple linear regression, etc.”
(1994 presidential address to the RSS)
Submitted by Margaret Cibes
Forsooth

American Journal of Human Genetics, February 2005
Submitted by Margaret Cibes