Sandbox: Difference between revisions
| Line 1: | Line 1: | ||
== | ==Forsooth== | ||
==Quotations== | |||
“We know that people tend to overestimate the frequency of well-publicized, spectacular | |||
events compared with more commonplace ones; this is a well-understood phenomenon in | |||
the literature of risk assessment and leads to the truism that when statistics plays folklore, | |||
folklore always wins in a rout.” | |||
<div align=right>-- Donald Kennedy (former president of Stanford University), ''Academic Duty'', Harvard University Press, 1997, p.17</div> | |||
---- | |||
"Using scientific language and measurement doesn’t prevent a researcher from conducting flawed experiments and drawing wrong conclusions — especially when they confirm preconceptions." | |||
<div align=right>-- Blaise Agüera y Arcas, Margaret Mitchell and Alexander Todoorov, quoted in: The racist history behind facial recognition, ''New York Times'', 10 July 2019</div> | |||
==In progress== | |||
[https://www.nytimes.com/2018/11/07/magazine/placebo-effect-medicine.html What if the Placebo Effect Isn’t a Trick?]<br> | |||
by Gary Greenberg, ''New York Times Magazine'', 7 November 2018 | |||
[https://www.nytimes.com/2019/07/17/opinion/pretrial-ai.html The Problems With Risk Assessment Tools]<br> | |||
[ | by Chelsea Barabas, Karthik Dinakar and Colin Doyle, ''New York Times'', 17 July 2019 | ||
by | |||
== | ==Hurricane Maria deaths== | ||
Laura Kapitula sent the following to the Isolated Statisticians e-mail list: | |||
[ | :[Why counting casualties after a hurricane is so hard]<br> | ||
by | :by Jo Craven McGinty, Wall Street Journal, 7 September 2018 | ||
The article is subtitled: Indirect deaths—such as those caused by gaps in medication—can occur months after a storm, complicating tallies | |||
Laura noted that | |||
:[https://www.washingtonpost.com/news/fact-checker/wp/2018/06/02/did-4645-people-die-in-hurricane-maria-nope/?utm_term=.0a5e6e48bf11 Did 4,645 people die in Hurricane Maria? Nope.]<br> | |||
:by Glenn Kessler, ''Washington Post'', 1 June 2018 | |||
The source of the 4645 figure is a [https://www.nejm.org/doi/full/10.1056/NEJMsa1803972 NEJM article]. Point estimate, the 95% confidence interval ran from 793 to 8498. | |||
President Trump has asserted that the actual number is | |||
[https://twitter.com/realDonaldTrump/status/1040217897703026689 6 to 18]. | |||
The ''Post'' article notes that Puerto Rican official had asked researchers at George Washington University to do an estimate of the death toll. That work is not complete. | |||
[https://prstudy.publichealth.gwu.edu/ George Washington University study] | |||
:[https://fivethirtyeight.com/features/we-still-dont-know-how-many-people-died-because-of-katrina/?ex_cid=538twitter We sttill don’t know how many people died because of Katrina]<br> | |||
:by Carl Bialik, FiveThirtyEight, 26 August 2015 | |||
---- | |||
[https://www.nytimes.com/2018/09/11/climate/hurricane-evacuation-path-forecasts.html These 3 Hurricane Misconceptions Can Be Dangerous. Scientists Want to Clear Them Up.]<br> | |||
[https://journals.ametsoc.org/doi/abs/10.1175/BAMS-88-5-651 Misinterpretations of the “Cone of Uncertainty” in Florida during the 2004 Hurricane Season]<br> | |||
[https://www.nhc.noaa.gov/aboutcone.shtml Definition of the NHC Track Forecast Cone] | |||
---- | |||
[https://www.popsci.com/moderate-drinking-benefits-risks Remember when a glass of wine a day was good for you? Here's why that changed.] | |||
''Popular Science'', 10 September 2018 | |||
---- | |||
[https://www.economist.com/united-states/2018/08/30/googling-the-news Googling the news]<br> | |||
''Economist'', 1 September 2018 | |||
[https://www.cnbc.com/2018/09/17/google-tests-changes-to-its-search-algorithm-how-search-works.html We sat in on an internal Google meeting where they talked about changing the search algorithm — here's what we learned] | |||
---- | |||
[http://www.wyso.org/post/stats-stories-reading-writing-and-risk-literacy Reading , Writing and Risk Literacy] | |||
[http://www.riskliteracy.org/] | |||
----- | |||
[https://twitter.com/i/moments/1025000711539572737?cn=ZmxleGlibGVfcmVjc18y&refsrc=email Today is the deadliest day of the year for car wrecks in the U.S.] | |||
==Some math doodles== | |||
<math>P \left({A_1 \cup A_2}\right) = P\left({A_1}\right) + P\left({A_2}\right) -P \left({A_1 \cap A_2}\right)</math> | |||
<math>P(E) = {n \choose k} p^k (1-p)^{ n-k}</math> | |||
<math>\hat{p}(H|H)</math> | |||
<math>\hat{p}(H|HH)</math> | |||
==Accidental insights== | |||
My collective understanding of Power Laws would fit beneath the shallow end of the long tail. Curiosity, however, easily fills the fat end. I long have been intrigued by the concept and the surprisingly common appearance of power laws in varied natural, social and organizational dynamics. But, am I just seeing a statistical novelty or is there meaning and utility in Power Law relationships? Here’s a case in point. | |||
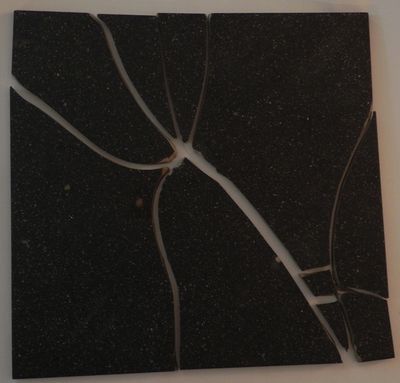
While carrying a pair of 10 lb. hand weights one, by chance, slipped from my grasp and fell onto a piece of ceramic tile I had left on the carpeted floor. The fractured tile was inconsequential, meant for the trash. | |||
<center>[[File:BrokenTile.jpg | 400px]]</center> | |||
As I stared, slightly annoyed, at the mess, a favorite maxim of the Greek philosopher, Epictetus, came to mind: “On the occasion of every accident that befalls you, turn to yourself and ask what power you have to put it to use.” Could this array of large and small polygons form a Power Law? With curiosity piqued, I collected all the fragments and measured the area of each piece. | |||
<center> | |||
{| class="wikitable" | |||
|- | |||
! Piece !! Sq. Inches !! % of Total | |||
|- | |||
| 1 || 43.25 || 31.9% | |||
|- | |||
| 2 || 35.25 ||26.0% | |||
|- | |||
| 3 || 23.25 || 17.2% | |||
|- | |||
| 4 || 14.10 || 10.4% | |||
|- | |||
| 5 || 7.10 || 5.2% | |||
|- | |||
| 6 || 4.70 || 3.5% | |||
|- | |||
| 7 || 3.60 || 2.7% | |||
|- | |||
| 8 || 3.03 || 2.2% | |||
|- | |||
| 9 || 0.66 || 0.5% | |||
|- | |||
| 10 || 0.61 || 0.5% | |||
|} | |||
</center> | |||
<center>[[File:Montante_plot1.png | 500px]]</center> | |||
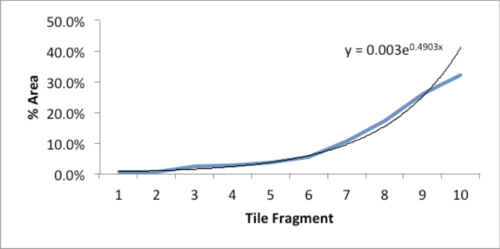
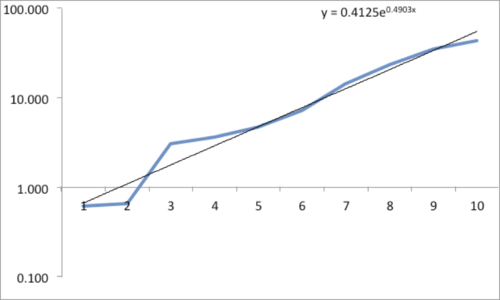
The data and plot look like a Power Law distribution. The first plot is an exponential fit of percent total area. The second plot is same data on a log normal format. Clue: Ok, data fits a straight line. I found myself again in the shallow end of the knowledge curve. Does the data reflect a Power Law or something else, and if it does what does it reflect? What insights can I gain from this accident? Favorite maxims of Epictetus and Pasteur echoed in my head: | |||
“On the occasion of every accident that befalls you, remember to turn to yourself and inquire what power you have to turn it to use” and “Chance favors only the prepared mind.” | |||
<center>[[File:Montante_plot2.png | 500px]]</center> | |||
My “prepared” mind searched for answers, leading me down varied learning paths. Tapping the power of networks, I dropped a note to Chance News editor Bill Peterson. His quick web search surfaced a story from ''Nature News'' on research by Hans Herrmann, et. al. [http://www.nature.com/news/2004/040227/full/news040223-11.html Shattered eggs reveal secrets of explosions]. As described there, researchers have found power-law relationships for the fragments produced by shattering a pane of glass or breaking a solid object, such as a stone. Seems there is a science underpinning how things break and explode; potentially useful in Forensic reconstructions. | |||
Bill also provided a link to [http://cran.r-project.org/web/packages/poweRlaw/vignettes/poweRlaw.pdf a vignette from CRAN] describing a maximum likelihood procedure for fitting a Power Law relationship. I am now learning my way through that. | |||
Submitted by William Montante | |||
---- | |||
Latest revision as of 20:58, 17 July 2019
Forsooth
Quotations
“We know that people tend to overestimate the frequency of well-publicized, spectacular events compared with more commonplace ones; this is a well-understood phenomenon in the literature of risk assessment and leads to the truism that when statistics plays folklore, folklore always wins in a rout.”
"Using scientific language and measurement doesn’t prevent a researcher from conducting flawed experiments and drawing wrong conclusions — especially when they confirm preconceptions."
In progress
What if the Placebo Effect Isn’t a Trick?
by Gary Greenberg, New York Times Magazine, 7 November 2018
The Problems With Risk Assessment Tools
by Chelsea Barabas, Karthik Dinakar and Colin Doyle, New York Times, 17 July 2019
Hurricane Maria deaths
Laura Kapitula sent the following to the Isolated Statisticians e-mail list:
- [Why counting casualties after a hurricane is so hard]
- by Jo Craven McGinty, Wall Street Journal, 7 September 2018
The article is subtitled: Indirect deaths—such as those caused by gaps in medication—can occur months after a storm, complicating tallies
Laura noted that
- Did 4,645 people die in Hurricane Maria? Nope.
- by Glenn Kessler, Washington Post, 1 June 2018
The source of the 4645 figure is a NEJM article. Point estimate, the 95% confidence interval ran from 793 to 8498.
President Trump has asserted that the actual number is 6 to 18. The Post article notes that Puerto Rican official had asked researchers at George Washington University to do an estimate of the death toll. That work is not complete. George Washington University study
- We sttill don’t know how many people died because of Katrina
- by Carl Bialik, FiveThirtyEight, 26 August 2015
These 3 Hurricane Misconceptions Can Be Dangerous. Scientists Want to Clear Them Up.
Misinterpretations of the “Cone of Uncertainty” in Florida during the 2004 Hurricane Season
Definition of the NHC Track Forecast Cone
Remember when a glass of wine a day was good for you? Here's why that changed. Popular Science, 10 September 2018
Googling the news
Economist, 1 September 2018
Reading , Writing and Risk Literacy
Today is the deadliest day of the year for car wrecks in the U.S.
Some math doodles
<math>P \left({A_1 \cup A_2}\right) = P\left({A_1}\right) + P\left({A_2}\right) -P \left({A_1 \cap A_2}\right)</math>
<math>P(E) = {n \choose k} p^k (1-p)^{ n-k}</math>
<math>\hat{p}(H|H)</math>
<math>\hat{p}(H|HH)</math>
Accidental insights
My collective understanding of Power Laws would fit beneath the shallow end of the long tail. Curiosity, however, easily fills the fat end. I long have been intrigued by the concept and the surprisingly common appearance of power laws in varied natural, social and organizational dynamics. But, am I just seeing a statistical novelty or is there meaning and utility in Power Law relationships? Here’s a case in point.
While carrying a pair of 10 lb. hand weights one, by chance, slipped from my grasp and fell onto a piece of ceramic tile I had left on the carpeted floor. The fractured tile was inconsequential, meant for the trash.

As I stared, slightly annoyed, at the mess, a favorite maxim of the Greek philosopher, Epictetus, came to mind: “On the occasion of every accident that befalls you, turn to yourself and ask what power you have to put it to use.” Could this array of large and small polygons form a Power Law? With curiosity piqued, I collected all the fragments and measured the area of each piece.
| Piece | Sq. Inches | % of Total |
|---|---|---|
| 1 | 43.25 | 31.9% |
| 2 | 35.25 | 26.0% |
| 3 | 23.25 | 17.2% |
| 4 | 14.10 | 10.4% |
| 5 | 7.10 | 5.2% |
| 6 | 4.70 | 3.5% |
| 7 | 3.60 | 2.7% |
| 8 | 3.03 | 2.2% |
| 9 | 0.66 | 0.5% |
| 10 | 0.61 | 0.5% |

The data and plot look like a Power Law distribution. The first plot is an exponential fit of percent total area. The second plot is same data on a log normal format. Clue: Ok, data fits a straight line. I found myself again in the shallow end of the knowledge curve. Does the data reflect a Power Law or something else, and if it does what does it reflect? What insights can I gain from this accident? Favorite maxims of Epictetus and Pasteur echoed in my head: “On the occasion of every accident that befalls you, remember to turn to yourself and inquire what power you have to turn it to use” and “Chance favors only the prepared mind.”

My “prepared” mind searched for answers, leading me down varied learning paths. Tapping the power of networks, I dropped a note to Chance News editor Bill Peterson. His quick web search surfaced a story from Nature News on research by Hans Herrmann, et. al. Shattered eggs reveal secrets of explosions. As described there, researchers have found power-law relationships for the fragments produced by shattering a pane of glass or breaking a solid object, such as a stone. Seems there is a science underpinning how things break and explode; potentially useful in Forensic reconstructions. Bill also provided a link to a vignette from CRAN describing a maximum likelihood procedure for fitting a Power Law relationship. I am now learning my way through that.
Submitted by William Montante