Chance News 98: Difference between revisions
| (48 intermediate revisions by 2 users not shown) | |||
| Line 1: | Line 1: | ||
February 21, 2014 to April 5, 2014 | |||
==Quotations== | ==Quotations== | ||
"In statistics it's enough for our results to be cool. In psychology they're supposed to be | "In statistics it's enough for our results to be cool. In psychology they're supposed to be | ||
correct. In economics they're supposed to be correct and consistent with your ideology." | correct. In economics they're supposed to be correct and consistent with your ideology." | ||
<div align=right> --Andrew Gelman, "75 best lines from my [http://www.stat.columbia.edu/~gelman/book/ Bayesian Analysis] course"</div> | <div align=right> -- Andrew Gelman, "75 best lines from my [http://www.stat.columbia.edu/~gelman/book/ Bayesian Analysis] course"</div> | ||
Some other selections: | Some other selections: | ||
| Line 15: | Line 17: | ||
"In our lust for measurement, we frequently measure that which we can rather than that which we wish to measure...and forget that there is a difference." | "In our lust for measurement, we frequently measure that which we can rather than that which we wish to measure...and forget that there is a difference." | ||
<div align=right>George Udny Yule, cited by David Salsburg<br> | <div align=right>-- George Udny Yule, cited by David Salsburg<br> | ||
[http://webcache.googleusercontent.com/search?q=cache:hfn8nmBf-HcJ:apstatsmonkey.com/StatsMonkey/ReadBestPractice_files/Salsburg.pptx+&cd=4&hl=en&ct=clnk&gl=us&client=firefox-a “Statistics and Experimentation”], AP Statistics Reading, June 16, 2011</div> | [http://webcache.googleusercontent.com/search?q=cache:hfn8nmBf-HcJ:apstatsmonkey.com/StatsMonkey/ReadBestPractice_files/Salsburg.pptx+&cd=4&hl=en&ct=clnk&gl=us&client=firefox-a “Statistics and Experimentation”], AP Statistics Reading, June 16, 2011</div> | ||
"'We value what we measure rather than measuring what we value' is an expression commonly heard in education circles these days." | "'We value what we measure rather than measuring what we value' is an expression commonly heard in education circles these days." | ||
<div align=right>Brandon Busteed, [http://www.huffingtonpost.com/brandon-busteed/colleges-should-measure-w_b_1614006.html “Colleges Should Measure What They Value”], HUFF Post, June 21, 2012</div> | <div align=right>-- Brandon Busteed, [http://www.huffingtonpost.com/brandon-busteed/colleges-should-measure-w_b_1614006.html “Colleges Should Measure What They Value”], HUFF Post, June 21, 2012</div> | ||
Submitted by Margaret Cibes | Submitted by Margaret Cibes | ||
| Line 38: | Line 40: | ||
Submitted by Margaret Cibes | Submitted by Margaret Cibes | ||
---- | |||
"If at first you don’t succeed,<br> | |||
Try twice more so your failure will be statistically significant." | |||
<div align=right>-- anonymous</div> | |||
Sent to the Isolated Statisticians list by Paul Velleman | |||
==Forsooth== | ==Forsooth== | ||
A Google search for “apophenia” yielded the following: | A Google search for [http://en.wikipedia.org/wiki/Apophenia “apophenia”] yielded the following Wikipedia entries:<br> | ||
(a) “the experience of seeing patterns or connections in random or <i><b>meaningless</b></i> data”<br> | |||
(b) “an example of a Type I error … – the identification of <i><b>false</b></i> patterns in data”<br> | |||
(c) “heavily documented as a source of rationale behind gambling, with gamblers <i><b>imagining</b></i> they see patterns in the occurrence of numbers in lotteries, roulette wheels, and even cards” [emphasis added]<br> | |||
An [http://apophenia.info/ apophenia] website described it as: | |||
“an open statistical library for working with sets and statistical models. It provides functions on the same level as those of the typical stats package … but <i>gives the user more flexibility to be <b>creative</b> in model-building</i>.” [emphasis added]<br> | |||
Submitted by Margaret Cibes | |||
---- | |||
From [http://www.amazon.com/What-Numbers-Say-Mastering-Numerical/dp/0767909992 <i>What the Numbers Say</i>], by Niederman and Boyum (2003):<br> | |||
“Out there, just in our galaxy alone, there are 400 billion stars. If only one out of a million of those had planets, and if just one of a million of those had life, and if just one out of a million of those had intelligent life, there would be literally millions of civilizations out there.” [quoting from film <i>Contact</i>, pp. 105-106]<br> | |||
“Ninety-nine times out of 10 you’re not going to win like that.” [quoting USAF Academy football coach Fisher DeBerry, p. 172]<br> | |||
“In 1998 there were 361 fatal accidents out of 39 million flights. The ‘risk’ of a fatal accident is only 0.000009 percent.” [quoting from letter defending airline safety, p. 172]<br> | |||
Submitted by Margaret Cibes | Submitted by Margaret Cibes | ||
---- | ---- | ||
"[The author of <i>The Perfect Score Project</i>] can never quite figure out why there isn’t a hundredth percentile.” | |||
<div align=right>[http://www.newyorker.com/reporting/2014/03/03/140303fa_fact_kolbert “Big Score: When Mom takes the SATs”], <i>The New Yorker</i>, March 3, 2014</div> | |||
“Afterwards I asked the physio how I was doing. His exact words: ’You're in the upper half of the 100th percentile of all the ACL recovery patients I've seen.’" | |||
<div align=right>[http://nwontario.blogspot.com/2013/04/at-hundredth-percentile.html “At the Hundredth Percentile”], Stuff and Nonsense blog, April 7, 2013</div> | |||
See “interesting” explanations of “hundredth percentile” at [http://www.letsrun.com/forum/flat_read.php?thread=4186592 LetsRun.com]. | |||
Submitted by Margaret Cibes | |||
==More on Dennis Lindley== | |||
The last installment of Chance News included a note [http://test.causeweb.org/wiki/chance/index.php/Chance_News_97#Dennis_Lindley Dennis Lindley], who passed away last December. Douglas Rogers noted that Lindley's obituary only recently appeared in ''The Guardian'': [http://www.theguardian.com/science/2014/mar/16/dennis-lindley Dennis Lindley obituary: Mathematician who was a leading figure in the Bayesian school of statistics] (by Dennis Hand, 16 March 2014). | |||
Douglas also shared the following reference, which he received from Sandy Zabell. | |||
It describes the evolution of Lindley's work over the years. | |||
:[https://projecteuclid.org/euclid.ss/1177009940 A conversation with Dennis Lindley]<br> | |||
:by Adrian Smith, ''Statistical Science'', v.10 n.3 (1995) | |||
==Some frightening graphs== | ==Some frightening graphs== | ||
| Line 80: | Line 107: | ||
<center> | <center> | ||
[[File:F2_BCmortality.png | 400px]] | [[File:F2_BCmortality.png | 400px]] | ||
'''Fig 2 All cause mortality, by assignment to mammography or control arms (all participants)''' | |||
</center> | </center> | ||
<br> | <br> | ||
<center> | <center> | ||
[[File:F3_BCspecific.png | 400px]] | [[File:F3_BCspecific.png | 400px]] | ||
'''Fig 3 Breast cancer specific mortality, by assignment to mammography or control arms (all participants)''' | |||
</center> | </center> | ||
<br> | <br> | ||
<center> | <center> | ||
[[File:F4_BCdiagnosis.png | 400px]] | [[File:F4_BCdiagnosis.png | 400px]] | ||
'''Fig 4 Breast cancer specific mortality from cancers diagnosed in screening period, by assignment to mammography or control arms''' | |||
</center> | </center> | ||
This very large--a sample size of approximately 90,000-- 25 year randomized control trial concludes that | This very large--a sample size of approximately 90,000-- 25 year randomized control trial concludes that | ||
| Line 139: | Line 169: | ||
==The whole and its parts== | ==The whole and its parts== | ||
[http://www.npr.org/blogs/thesalt/2014/02/12/275376259/the-full-fat-paradox-whole-milk-may-keep-us-lean The full-fat paradox: Whole milk may keep us lean]<br> | [http://www.npr.org/blogs/thesalt/2014/02/12/275376259/the-full-fat-paradox-whole-milk-may-keep-us-lean The full-fat paradox: Whole milk may keep us lean]<br> | ||
by Allison Aubrey, NPR, 12 February | by Allison Aubrey, NPR "Morning Edition", 12 February 2014 | ||
According to Aubey | According to Aubey | ||
| Line 225: | Line 255: | ||
Submitted by Paul Alper | Submitted by Paul Alper | ||
==Old Vegas slot machine awaits jackpot winner== | |||
[http://online.wsj.com/news/articles/SB10001424052702303973704579354830486470944?KEYWORDS=rob+copeland+-+vegas&mg=reno64-wsj “Vegas Gamblers Keep Vigil on Aging Slot Machine They Expect to Pay Off Millions”]<br> | |||
by Rob Copeland, <i>The Wall Street Journal</i>, February 6, 2014<br> | |||
There is a 20-year-old slot machine at the MGM Grand that “hasn’t produced a jackpot in nearly two decades.” While no one has yet won the jackpot, now estimated at $2.3 million, one can earn up to $10,000 on one play of this slot machine.<br> | |||
Although some are skeptical, the Grand claims that the odds have never been changed. Others exhibit a number of superstitious behaviors, including pulling the lever only on its right side, hitting the “spin” button with their feet, and talking to, or rubbing, the machine.<br> | |||
Submitted by Margaret Cibes | |||
==Celebrating Pi Day with random walks== | |||
Olena Ostasheva sent a link to this story: | |||
:[http://www.theguardian.com/science/alexs-adventures-in-numberland/gallery/2014/mar/14/pi-day-pi-transformed-into-incredible-art-in-pictures Pi Day: pi transformed into incredible art – in pictures]<br> | |||
:by Alex Bellos, ''Guardian'', 14 March 2014 | |||
Click on the article link for some striking images of "random walks" based on the digits of pi. Here is one | |||
<center>[[File:Pi_RW.png |350px]]</center> | |||
reproduced from Bellos' book ''Alex's Adventures in Numberland'' (published in the US as ''Here's Looking at Euclid'' [http://alexbellos.com]). Bellos claims this is historically the first example of a random walk. It was presented by the mathematician John Venn, in his 1888 book ''The Logic of Chance''. Venn identified digits 0 through 7 with compass directions as shown to make the picture. | |||
==SAT and Kaplan prep== | |||
[http://www.newyorker.com/reporting/2014/03/03/140303fa_fact_kolbert “Big Score: When Mom takes the SATs”]<br> | |||
by Elizabeth Kolbert, <i>The New Yorker</i>, March 3, 2014<br> | |||
Kolbert decided to take the SAT in order to motivate her son to do so. Her article describes her experiences, as well as those of author Debbie Stier, who took the test seven times in one year and wrote about her experiences in the book [http://www.amazon.com/The-Perfect-Score-Project-Uncovering/dp/0307956679 <i>The Perfect Score Project: Uncovering the Secrets of the SAT</i>]. (Stier also has a blog, [http://perfectscoreproject.com/ Perfect Score Project].) | |||
<br> | |||
According to Kolbert, the Federal Trade Commission investigated Stanley Kaplan’s 1970s claim that coaching would improve scores, and (1978), it found that “Kaplan was right: tutoring did boost scores, if not by as much as his testing service advertised.”<br> | |||
See also [http://www.nacacnet.org/research/PublicationsResources/Marketplace/Documents/TestPrepDiscussionPaper.pdf Preparation for College Admission Exams] (National Association for College Admission Counseling, 2009): | |||
<blockquote>Coaching has a positive effect on SAT performance, but the magnitude of the effect is small. …. From a psychometric standpoint, when the average effects of coaching [about 30 points] are attributed to individual students who have been coached, these effects cannot be distinguished from measurement error.</blockquote> | |||
And see [http://test.causeweb.org/wiki/chance/index.php/Chance_News_48#SAT_Coaching Chance News 48] for more on SAT coaching courses and their methods. | |||
===Discussion=== | |||
1. There are at least two distinct groups of students who would seek an SAT prep class: (a) those with above average scores wanting to enter the most selective colleges or (b) those with below average scores wanting to enter any college. Speaking only statistically, which group would you expect to benefit most from coaching? Which would you expect to benefit least? Why?<br> | |||
2. Speaking non-statistically, do you believe that a 30-point increase in a score would increase a student’s likelihood of admission to a college? Why or why not? (See [http://www.nacacnet.org/research/PublicationsResources/Marketplace/Documents/TestPrepDiscussionPaper.pdf Preparation for College Admission Exams] (National Association for College Admission Counseling, 2009) for responses to this question from selective and from less selective college admission officers.)<br> | |||
Submitted by Margaret Cibes<br> | |||
(Disclosure: Submitter is former ETS employee and long-time contracted math item-writer.) | |||
==Two amusing alcohol graphics== | |||
1. We learned of the following item from Dan Velleman: | |||
:[http://www.theglobeandmail.com/life/food-and-wine/wine/tell-me-what-you-drink-and-ill-tell-you-how-youll-vote/article16323504/ Tell me what you drink, and I’ll tell you how you’ll vote]<br> | |||
:by Beppi Crosariol, ''The Globe and Mail'', 14 January 2014 | |||
The article includes a chart, entitled [http://www.theglobeandmail.com/life/food-and-wine/wine/chart-what-americans-drink-and-how-they-vote/article16323855/#dashboard/follows/ What Americans drink and how they vote] | |||
<center> [[File:WhatYouDrink.png | 500px]]</center> | |||
2. Douglas Rogers sent the following, which he dubbed a "wine series" plot! | |||
<center> [[File:Wine_series.png | 500px]]</center> | |||
It appears in | |||
:[http://www.telegraph.co.uk/finance/personalfinance/consumertips/household-bills/10133100/Bogus-offers-Beware-supermarket-wine-at-bargain-prices.html Beware supermarket wine 'bargains']<br> | |||
:by Rosie Murray-West, ''The Telegraph'', 21 June 2013 | |||
==March bracket madness== | |||
The last installment of Chance News reported on [http://test.causeweb.org/wiki/chance/index.php/Chance_News_97#Warren_Buffett.27s_billion_dollar_gamble Warren Buffett's gamble] on the NCAA basketball tournament. | |||
We received the following news updates from Jim Greenwood and Margaret Cibes | |||
*[http://www.nytimes.com/2014/03/16/sports/ncaabasketball/mathematicians-are-hoping-their-calculations-add-up-to-the-perfect-bracket.html Mathematicians are hoping their calculations add up to the perfect bracket], by Mary Pilon, ''New York Times'', 15 March 2014 | |||
* [http://www.nytimes.com/2014/03/25/sports/ncaabasketball/in-ncaa-tournament-bracket-mathematician-outdoes-matildas.html?hpw&rref=sports In N.C.A.A. tournament bracket, mathematician outdoes Matildas], by Joe Drape, ''New York Times'', 24 March 2014 | |||
These articles describe efforts by a Davidson College math professor, Tim Chartier, who used an algorithm based on applied linear algebra to make bracket predictions. Last year, three of Chartier's students scored in the 96th to 99th percentile range among thousands of entries in ESPN's bracket contest. | |||
Alas, this was a year with many surprising games, and, as reported in the second article, "it took less than two days of upsets to eliminate all of the brackets" so Buffett's prize will go unclaimed. | |||
==One coin puzzle, many solutions== | |||
[http://wordplay.blogs.nytimes.com/2014/03/17/coin/?module=BlogPost-Title&version=Blog%20Main&contentCollection=Numberplay&action=Click&pgtype=Blogs®ion=Body A coin problem]<br> | |||
by Gary Antonik, Numberplay blog, ''New York Times'', 17 March 2014 | |||
The post begins with this simple problem, posed by Daniel Finkel: | |||
<blockquote> | |||
Consider this simple game: flip a fair coin twice. You win if you get two heads, and lose otherwise. It’s not hard to calculate that the chances of winning are 1/4… . Your challenge is to design a game, using only a fair coin, that you have a 1/3 chance of winning. | |||
</blockquote> | |||
Finkel continues, "And here is my recipe for getting the most out of this problem: if you can solve it, do not stop with one answer. Rather, see how many answers you can come up with. I’ve posed this problem to many people, and I continue to hear novel solutions." | |||
Here are three familiar solutions (I notice the these also turned up quickly in readers' comments to the ''NYT''!): | |||
* Toss the coin until the first head appears. You win if this takes an even number of tosses | |||
* Toss the coin twice. You win on HH and lose on HT or TH. If TT appears, ignore the result and make another two tosses. | |||
* Toss the coin until the first appearance of HTT or HHT on consecutive tosses. You win HTT. | |||
The third is an instance of the game [http://en.wikipedia.org/wiki/Penney's_game Penney-Ante], invented by William Penney. It is a famous example of a non-transitive game: whatever triple the first player chooses, the second can choose a triple that has a better than even chance of coming up first. So if the you choose HTT, then second I will choose HHT, giving me a 2/3 chance of winning. | |||
But I was not aware, until searching for an online description of Penney-Ante, that there is a variation with cards, called the Humble-Nishiyama Randomness Game. As described [http://en.wikipedia.org/wiki/Penney's_game#Variation_with_playing_cards here] | |||
<blockquote> | |||
At the start of a game each player decides on their three colour sequence for the whole game. The cards are then turned over one at a time and placed in a line, until one of the chosen triples appears. The winning player takes the upturned cards, having won that "trick". The game continues with the rest of the unused cards, with players collecting tricks as their triples come up, until all the cards in the pack have been used. The winner of the game is the player that has won the most tricks. | |||
</blockquote> | |||
As noted there, the second player now has a greater advantage than in Penney's game. For example, if the first player chooses BRR, the second should choose BBR. This corresponds to the HTT vs. HHT in Penney Ante. But now there is only a 5.18% that the first player wins, and 88.29% chance that the second player wins, and a 6.53% chance of a draw (a full table is available at the above link). | |||
In fact, the Humble-Nishiyama game [http://wordplay.blogs.nytimes.com/2014/02/17/card/ appeared in the Numberplay blog] on 17 February 2014! That post includes a link to an [http://www.garyhewitt.net/nyt/penney.html interactive simulation] that allows you to play against the computer with a deck of 52 cards or an infinite deck (this reverts to Penney Ante). | |||
'''Discussion'''<br> | |||
What other solutions can you come up with to Finkel's original puzzle? Then look at the reader comments for more. | |||
Submitted by Bill Peterson | |||
==Fox apologizes for chart== | |||
[http://live.huffingtonpost.com/r/archive/segment/fox-news-apologizes-for-obamacare-graphic-corrects-its-mistake/533c1fa5fe34442800000024?cn=tbla\ Huff Post Live], April 3, 2014<br> | |||
Fox News first broadcast the following chart: | |||
<center>[[File:FoxBefore.png | 300px]]</center> | |||
Then it issued an apology for a "seriously misleading Obamacare graphic, saying it had made a 'mistake.'" Fox News then broadcast the following, revised chart: | |||
<center>[[File:FoxAfter.png | 300px]]</center> | |||
Submitted by Margaret Cibes | |||
Latest revision as of 17:15, 7 April 2014
February 21, 2014 to April 5, 2014
Quotations
"In statistics it's enough for our results to be cool. In psychology they're supposed to be correct. In economics they're supposed to be correct and consistent with your ideology."
Some other selections:
- “God created the world in 7 days and we haven’t seen much of him since.” (God draws θ from an urn and then is out of the picture)
- “People don’t go around introducing you to their ex-wives.” (why model improvement doesn’t make it into papers)
Submitted by Paul Alper
"In our lust for measurement, we frequently measure that which we can rather than that which we wish to measure...and forget that there is a difference."
“Statistics and Experimentation”, AP Statistics Reading, June 16, 2011
"'We value what we measure rather than measuring what we value' is an expression commonly heard in education circles these days."
Submitted by Margaret Cibes
From What the Numbers Say, by Niederman and Boyum, 2003:
“Unfortunately, Americans seem much better at producing numbers than making sense of them.” [p. 1]
“Distrusting numbers is not the same as disregarding them.” [p. 11]
“[G]ive more credence to a finding if there is good reason to believe it for reasons other than its statistical significance.” [p. 219]
“Elizabeth Taylor’s Law (the marital version of Pareto’s Law) reminds us that a small fraction of the population accounts for a disproportionate share of divorces.” [p. 17]
“[M]ost people not only lack a notation for dealing with small numbers, they also lack a vocabulary. If you show a man the number 3,500,000 and ask what it is, he will say, with little if any hesitation, ‘three and a half million’ … or ‘three million five hundred thousand.’ But if you show him 0.00000029, he will probably respond, ‘point oh oh oh oh oh oh two nine,’ slowly …. [J]ust imagine a politician describing the defense budget as ‘three six nine oh oh oh oh oh oh oh oh oh dollars.” [pp. 117-118]
Submitted by Margaret Cibes
"If at first you don’t succeed,
Try twice more so your failure will be statistically significant."
Sent to the Isolated Statisticians list by Paul Velleman
Forsooth
A Google search for “apophenia” yielded the following Wikipedia entries:
(a) “the experience of seeing patterns or connections in random or meaningless data”
(b) “an example of a Type I error … – the identification of false patterns in data”
(c) “heavily documented as a source of rationale behind gambling, with gamblers imagining they see patterns in the occurrence of numbers in lotteries, roulette wheels, and even cards” [emphasis added]
An apophenia website described it as:
“an open statistical library for working with sets and statistical models. It provides functions on the same level as those of the typical stats package … but gives the user more flexibility to be creative in model-building.” [emphasis added]
Submitted by Margaret Cibes
From What the Numbers Say, by Niederman and Boyum (2003):
“Out there, just in our galaxy alone, there are 400 billion stars. If only one out of a million of those had planets, and if just one of a million of those had life, and if just one out of a million of those had intelligent life, there would be literally millions of civilizations out there.” [quoting from film Contact, pp. 105-106]
“Ninety-nine times out of 10 you’re not going to win like that.” [quoting USAF Academy football coach Fisher DeBerry, p. 172]
“In 1998 there were 361 fatal accidents out of 39 million flights. The ‘risk’ of a fatal accident is only 0.000009 percent.” [quoting from letter defending airline safety, p. 172]
Submitted by Margaret Cibes
"[The author of The Perfect Score Project] can never quite figure out why there isn’t a hundredth percentile.”
“Afterwards I asked the physio how I was doing. His exact words: ’You're in the upper half of the 100th percentile of all the ACL recovery patients I've seen.’"
See “interesting” explanations of “hundredth percentile” at LetsRun.com.
Submitted by Margaret Cibes
More on Dennis Lindley
The last installment of Chance News included a note Dennis Lindley, who passed away last December. Douglas Rogers noted that Lindley's obituary only recently appeared in The Guardian: Dennis Lindley obituary: Mathematician who was a leading figure in the Bayesian school of statistics (by Dennis Hand, 16 March 2014).
Douglas also shared the following reference, which he received from Sandy Zabell. It describes the evolution of Lindley's work over the years.
- A conversation with Dennis Lindley
- by Adrian Smith, Statistical Science, v.10 n.3 (1995)
Some frightening graphs
Most people believe that
- Unless treated, cancer is necessarily fatal; and
- The earlier cancer is diagnosed and treated, the more likely the cure
Because cancer is a catchall term, #1 is certainly wrong. Some cancers grow so slowly that death is due to another cause. Indeed, some cancers are so indolent that a person may lead an entire life unaware even of the existence of the cancer. Therefore, in spite of its plausibility, #2 is suspect because diagnoses based on a screening test might lead to unnecessary and harmful treatments.
The following five graphs found in an article by Welch and Black illustrate this conundrum of modern medicine: it can do a great deal of harm precisely because it is so good at doing things such as finding abnormalities which represent non-threatening deviations from what is deemed normal.
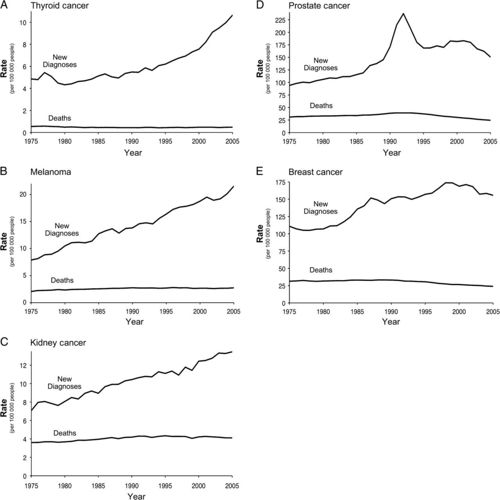
Notice that for each of the five cancers, its time series of mortality is flat whereas the number of new diagnoses rises prohibitively over time indicating overdiagnosis and therefore, overtreatment with consequent suffering. As another instance of overdiagnosis, overtreatment and consequent suffering, the following three figures are taken from an article by Miller, et al, in the British Medical Journal (BMJ 2014;348:g366 doi: 10.1136/bmj.g366), entitled “Twenty five year follow-up for breast cancer incidence and mortality of the Canadian National Breast Screening Study: randomised screening trial.”
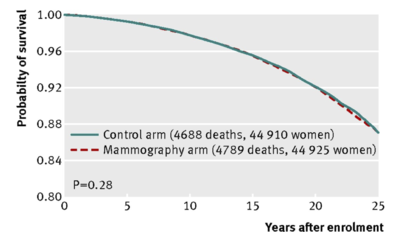
Fig 2 All cause mortality, by assignment to mammography or control arms (all participants)
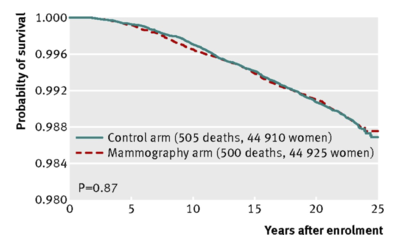
Fig 3 Breast cancer specific mortality, by assignment to mammography or control arms (all participants)
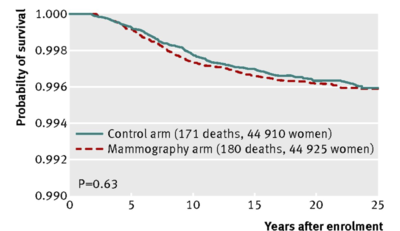
Fig 4 Breast cancer specific mortality from cancers diagnosed in screening period, by assignment to mammography or control arms
This very large--a sample size of approximately 90,000-- 25 year randomized control trial concludes that
Annual mammography in women aged 40-59 does not reduce mortality from breast cancer beyond that of physical examination or usual care when adjuvant therapy for breast cancer is freely available. Overall, 22% (106/484) of screen detected invasive breast cancers were over-diagnosed, representing one over-diagnosed breast cancer for every 424 women who received mammography screening in the trial.
Discussion
1. With regard to the five time series, suppose instead of overdiagnosis and overtreatment, the following (reverse causality) argument is made: despite the rise in each of the cancers, modern medicine has kept the mortality constant. Comment on this assertion.
2. Notice that in the above Figs 2, 3 and 4, a p-value is given for the comparison between the mammography arm and the control arm. Looking at the curves themselves, comment as to why it makes sense that each of the p-values is well above the mystical .05.
3. With regard to the mammography study, there is an accompanying editorial in the BMJ entitled “Too much mammography.” This editorial goes on to compare and contrast PSA screening with mammography. Although PSA screening and mammography seem to be very similar "owing to [the] small effect on mortality and large risk of overdiagnosis ([1]),"
Nevertheless, the UK National Screening Committee does recommend mammography screening for breast cancer but not prostate specific antigen screening for prostate cancer.
Because the scientific rationale to recommend screening or not does not differ noticeably between breast and prostate cancer, political pressure and beliefs might have a role.
We agree with Miller and colleagues that “the rationale for screening by mammography be urgently reassessed by policy makers.” As time goes by we do indeed need more efficient mechanisms to reconsider priorities and recommendations for mammography screening and other medical interventions. This is not an easy task, because governments, research funders, scientists, and medical practitioners may have vested interests in continuing activities that are well established.
Comment on the vested interests and why the task is difficult.
4. Although the study by Miller is in some sense a bombshell, note that evidence has existed for over 10 years previous that mammography screening for women under 60 years of age had severe problems.
Our finding of increased mastectomies has consistently been ignored by screening advocates for 10 years, and information from many cancer charities and governmental agencies continues to state the opposite – that screening decreases mastectomies - despite having no reliable data to support this claim.
As another instance of a (personal) vested interest, and to show how difficult it is to discuss the problems of mammography screening as seen by evidence based medicine, diplomatically engage a female and bring up the topic.
5. This is a link to a presentation given by Dr. H. Gilbert Welch a few years ago and thus, does not include the Miller Canadian study mentioned above. The video is 99 minutes in length but well worth seeing in its entirety. He discusses the five time series at length and he illustrates the deficiencies of mammography as was known then.
Submitted by Paul Alper
Knuth and sports statistics
On the Isolated Statisticians list, Albyn Jones shared a link he received to a short YouTube video entitled The Electronic Coach. It features the famous computer scientist Donald Knuth as a student in the 1950s, using computer analysis (punch cards and all!) to help his college's basketball team.
The whole and its parts
The full-fat paradox: Whole milk may keep us lean
by Allison Aubrey, NPR "Morning Edition", 12 February 2014
According to Aubey
The reason we're told to limit dairy fat seems pretty straightforward. The extra calories packed into the fat are bad for our waistlines — that's the assumption.
But what if dairy fat isn't the dietary demon we've been led to believe it is? New research suggests we may want to look anew.
In one study published by Swedish researchers in the Scandinavian Journal of Primary Health Care, middle-aged men who consumed high-fat milk, butter and cream were significantly less likely to become obese over a period of 12 years compared with men who never or rarely ate high-fat dairy.
Yep, that's right. The butter and whole-milk eaters did better at keeping the pounds off.
The study itself “followed a cohort of rural men over 12 years” because “In a previous study we found that daily intake of fruit and vegetables in combination with a high dairy fat intake was associated with a lower risk of coronary heart disease”:
1782 men (farmers and non-farmers) aged 40–60 years at baseline participated in a baseline survey (participation rate 76%) and 1589 men participated at the follow-up. 116 men with central obesity at baseline were excluded from the analyses.
Central obesity was defined as waist hip ratio ≥ 1. Waist and hip measurements were taken at both surveys with a tape measure at the level of the umbilicus and at the widest part of the hips with the participants dressed in light wear.
The conclusion drawn is
We found that a low intake of dairy fat was associated with a higher risk of developing central obesity and that a high intake of dairy fat was associated with a lower risk of central obesity among men without central obesity at baseline. The majority of the participants were overweight or obese as defined by BMI at baseline. However, the associations between dairy fat intake and central obesity were consistent across BMI categories at baseline.
The table below is reproduced from Table III in the original paper. It indicates that regardless of which model is used, on average, high fat participants have a < 1 waist hip ratio while on average, low fat participants have > 1 waist hip ratio.
Risk of central obesity (waist hip ratio ≥ 1) at follow-up according to dairy fat intake at baseline.
Only men with waist hip ratio < 1 at baseline were included.
Dairy fat intake |
Crude (n = 1,303) OR3 (95% CI) |
Model 11 (n = 1285) OR3 (95% CI) |
Model 12 (n = 1261) OR3 (95% CI) |
| Low (no butter and low fat milk and seldom/never whipping cream) |
1.40 (0.97–2.03) | 1.45 (0.99–2.11) | 1.53 (1.05–2.24) |
| Medium (all other combinations of spread, milk, and whipping cream) |
1 | 1 | 1 |
| High (butter and high fat milk and whipping cream daily or several times a week) |
0.53 (0.34–0.83) | 0.50 (0.31–0.80) | 0.52 (0.33–0.83) |
1Adjusted for fruit and vegetables daily, smoking, alcohol consumption, and physical activity.
2Adjusted as above plus age, education, and profession.
3Odds ratio with 95% confidence intervals.
Discussion
1. This Swedish study is clearly not a randomized clinical trial and depends in some manner on self reporting. Why is this a problem? Why is any inference to a larger population also a problem?
2. This Swedish study has males only included. How does this limit any inference?
3. “Cheese and yoghurt for example were not included/not asked about, nor the vast list of processed dairy products available in the supermarkets of today.” What effect if any might there be because of the exclusion of cheese, yoghurt and other processed dairy products?
4. According to Aubrey, there exists a second study, published in the European Journal of Nutrition, which
is a meta-analysis of 16 observational studies. There has been a hypothesis that high-fat dairy foods contribute to obesity and heart disease risk, but the reviewers concluded that the evidence does not support this hypothesis. In fact, the reviewers found that in most of the studies, high-fat dairy was associated with a lower risk of obesity.
"We continue to see more and more data coming out [finding that] consumption of whole-milk dairy products is associated with reduced body fat," says the executive vice president of the National Dairy Council.
Aubrey suggests “the satiety factor. The higher levels of fat in whole milk products may make us feel fuller, faster. And as a result, the thinking goes, we may end up eating less.” She further adds
As we reported last year, a study of children published in the Archives Of Diseases in Childhood, a sister publication of the British Medical Journal, concluded that low-fat milk was associated with more weight gain over time.
5. Consider “the satiety factor”--full fat keeps us lean--mentioned above. What sort of analogy might there be to gun ownership and safety? Excellent brakes and auto accidents? A GPS system and getting lost?
Submitted by Paul Alper
Old Vegas slot machine awaits jackpot winner
“Vegas Gamblers Keep Vigil on Aging Slot Machine They Expect to Pay Off Millions”
by Rob Copeland, The Wall Street Journal, February 6, 2014
There is a 20-year-old slot machine at the MGM Grand that “hasn’t produced a jackpot in nearly two decades.” While no one has yet won the jackpot, now estimated at $2.3 million, one can earn up to $10,000 on one play of this slot machine.
Although some are skeptical, the Grand claims that the odds have never been changed. Others exhibit a number of superstitious behaviors, including pulling the lever only on its right side, hitting the “spin” button with their feet, and talking to, or rubbing, the machine.
Submitted by Margaret Cibes
Celebrating Pi Day with random walks
Olena Ostasheva sent a link to this story:
- Pi Day: pi transformed into incredible art – in pictures
- by Alex Bellos, Guardian, 14 March 2014
Click on the article link for some striking images of "random walks" based on the digits of pi. Here is one
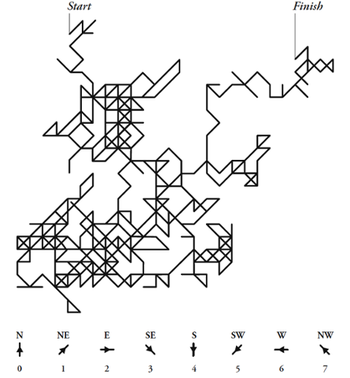
reproduced from Bellos' book Alex's Adventures in Numberland (published in the US as Here's Looking at Euclid [2]). Bellos claims this is historically the first example of a random walk. It was presented by the mathematician John Venn, in his 1888 book The Logic of Chance. Venn identified digits 0 through 7 with compass directions as shown to make the picture.
SAT and Kaplan prep
“Big Score: When Mom takes the SATs”
by Elizabeth Kolbert, The New Yorker, March 3, 2014
Kolbert decided to take the SAT in order to motivate her son to do so. Her article describes her experiences, as well as those of author Debbie Stier, who took the test seven times in one year and wrote about her experiences in the book The Perfect Score Project: Uncovering the Secrets of the SAT. (Stier also has a blog, Perfect Score Project.)
According to Kolbert, the Federal Trade Commission investigated Stanley Kaplan’s 1970s claim that coaching would improve scores, and (1978), it found that “Kaplan was right: tutoring did boost scores, if not by as much as his testing service advertised.”
See also Preparation for College Admission Exams (National Association for College Admission Counseling, 2009):
Coaching has a positive effect on SAT performance, but the magnitude of the effect is small. …. From a psychometric standpoint, when the average effects of coaching [about 30 points] are attributed to individual students who have been coached, these effects cannot be distinguished from measurement error.
And see Chance News 48 for more on SAT coaching courses and their methods.
Discussion
1. There are at least two distinct groups of students who would seek an SAT prep class: (a) those with above average scores wanting to enter the most selective colleges or (b) those with below average scores wanting to enter any college. Speaking only statistically, which group would you expect to benefit most from coaching? Which would you expect to benefit least? Why?
2. Speaking non-statistically, do you believe that a 30-point increase in a score would increase a student’s likelihood of admission to a college? Why or why not? (See Preparation for College Admission Exams (National Association for College Admission Counseling, 2009) for responses to this question from selective and from less selective college admission officers.)
Submitted by Margaret Cibes
(Disclosure: Submitter is former ETS employee and long-time contracted math item-writer.)
Two amusing alcohol graphics
1. We learned of the following item from Dan Velleman:
- Tell me what you drink, and I’ll tell you how you’ll vote
- by Beppi Crosariol, The Globe and Mail, 14 January 2014
The article includes a chart, entitled What Americans drink and how they vote
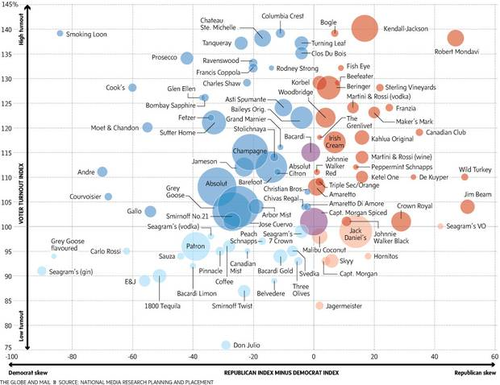
2. Douglas Rogers sent the following, which he dubbed a "wine series" plot!

It appears in
- Beware supermarket wine 'bargains'
- by Rosie Murray-West, The Telegraph, 21 June 2013
March bracket madness
The last installment of Chance News reported on Warren Buffett's gamble on the NCAA basketball tournament.
We received the following news updates from Jim Greenwood and Margaret Cibes
- Mathematicians are hoping their calculations add up to the perfect bracket, by Mary Pilon, New York Times, 15 March 2014
- In N.C.A.A. tournament bracket, mathematician outdoes Matildas, by Joe Drape, New York Times, 24 March 2014
These articles describe efforts by a Davidson College math professor, Tim Chartier, who used an algorithm based on applied linear algebra to make bracket predictions. Last year, three of Chartier's students scored in the 96th to 99th percentile range among thousands of entries in ESPN's bracket contest.
Alas, this was a year with many surprising games, and, as reported in the second article, "it took less than two days of upsets to eliminate all of the brackets" so Buffett's prize will go unclaimed.
One coin puzzle, many solutions
A coin problem
by Gary Antonik, Numberplay blog, New York Times, 17 March 2014
The post begins with this simple problem, posed by Daniel Finkel:
Consider this simple game: flip a fair coin twice. You win if you get two heads, and lose otherwise. It’s not hard to calculate that the chances of winning are 1/4… . Your challenge is to design a game, using only a fair coin, that you have a 1/3 chance of winning.
Finkel continues, "And here is my recipe for getting the most out of this problem: if you can solve it, do not stop with one answer. Rather, see how many answers you can come up with. I’ve posed this problem to many people, and I continue to hear novel solutions."
Here are three familiar solutions (I notice the these also turned up quickly in readers' comments to the NYT!):
- Toss the coin until the first head appears. You win if this takes an even number of tosses
- Toss the coin twice. You win on HH and lose on HT or TH. If TT appears, ignore the result and make another two tosses.
- Toss the coin until the first appearance of HTT or HHT on consecutive tosses. You win HTT.
The third is an instance of the game Penney-Ante, invented by William Penney. It is a famous example of a non-transitive game: whatever triple the first player chooses, the second can choose a triple that has a better than even chance of coming up first. So if the you choose HTT, then second I will choose HHT, giving me a 2/3 chance of winning.
But I was not aware, until searching for an online description of Penney-Ante, that there is a variation with cards, called the Humble-Nishiyama Randomness Game. As described here
At the start of a game each player decides on their three colour sequence for the whole game. The cards are then turned over one at a time and placed in a line, until one of the chosen triples appears. The winning player takes the upturned cards, having won that "trick". The game continues with the rest of the unused cards, with players collecting tricks as their triples come up, until all the cards in the pack have been used. The winner of the game is the player that has won the most tricks.
As noted there, the second player now has a greater advantage than in Penney's game. For example, if the first player chooses BRR, the second should choose BBR. This corresponds to the HTT vs. HHT in Penney Ante. But now there is only a 5.18% that the first player wins, and 88.29% chance that the second player wins, and a 6.53% chance of a draw (a full table is available at the above link).
In fact, the Humble-Nishiyama game appeared in the Numberplay blog on 17 February 2014! That post includes a link to an interactive simulation that allows you to play against the computer with a deck of 52 cards or an infinite deck (this reverts to Penney Ante).
Discussion
What other solutions can you come up with to Finkel's original puzzle? Then look at the reader comments for more.
Submitted by Bill Peterson
Fox apologizes for chart
Huff Post Live, April 3, 2014
Fox News first broadcast the following chart:
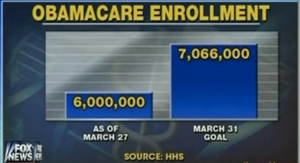
Then it issued an apology for a "seriously misleading Obamacare graphic, saying it had made a 'mistake.'" Fox News then broadcast the following, revised chart:
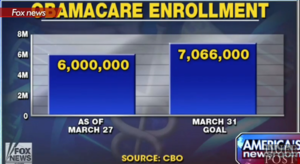
Submitted by Margaret Cibes
