|
The applet in this section allows you to see how the T distribution is related to the Standard Normal distribution by calculating probabilities.
The T distribution is primarily used to make inferences on a Normal mean when the variance is unknown.
If the variance is known inference on the mean can be done using the Standard Normal.
By estimating the variance from the data our inference is penalized relative to our sample size.
This is apparent by the larger variance exhibited in the T distribution and the lower probabilites relative to the Standard Normal.
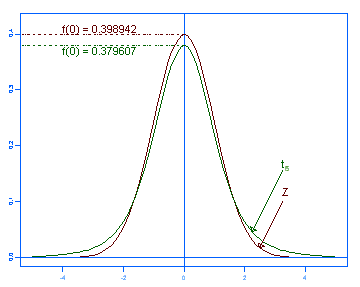
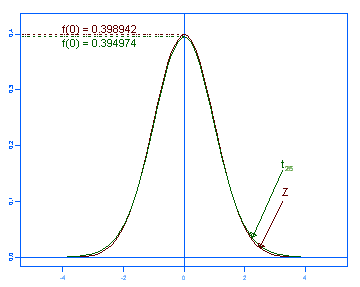
As the degrees of freedom ( ) increase the T distribution approaches the Standard Normal distribution (see Figure 1). ) increase the T distribution approaches the Standard Normal distribution (see Figure 1).

 |
| Figure 1. Increasing degrees of freedom from 5 to 25 makes the t distribution more like a standard normal. |
|
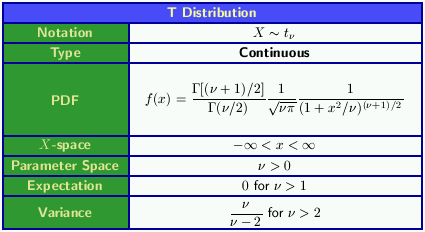
Details of the T distribution are given in Table 1.
Note the variance of the T distribution tends to one as  tends to infinity. tends to infinity.

|
|
Table 1. Details of the T distribution.
|
The Gamma function used in the T distribution p.d.f. is defined as
 | (1) |
A special case of (1) is
 | (2) |
which is used for integer degrees of freedom in the above distributions.
However, it should be noted that even though (2) is the most common case (e.g.  = n - 1),there is no requirement for degrees of freedom to be integers. = n - 1),there is no requirement for degrees of freedom to be integers.
See also: Probability Distributions, Normal Distribution, Exponential Distribution.
|