
18 Feb
2015
18 Feb
'15
5:06 p.m.
Hello Everyone-
I wanted to share an item I included on my recent AP Statistics test. We
had just finished traditional one sample tests for a proportion and one
sample tests for a mean. I introduced the chapter with a simulation-based
analysis of a test for a proportion, and we had done several similar
activities earlier in the year.
I like the item because it addresses the logic of inference, but doesn't
match up with one of our traditional tests. Also, because it is about
baseball!
I pasted it below and in the attachment. I also included a brief answer key
and comments on my student performance. Feel free to use it with your
students if you are interested.
Thanks,
Josh Tabor
In a recent Sports Illustrated article, author Michael Rosenberg addresses
"America's Wait Problem." That is, he discusses how fans of some teams
have
to wait many, many years for their team to win a championship. In Major
League Baseball, fans should expect to wait an average of 30 years for a
championship-assuming all 30 teams are equally likely to win a championship
each season.
But is it reasonable to believe that all teams are equally likely to win a
championship? In the last 19 seasons, only 10 different teams won a
championship. Does this provide convincing evidence that some teams are
more likely than others to win a championship? We can find out by testing
the following hypotheses:
H0: All 30 teams are equally likely to win a championship
Ha: Some teams are more likely to win a championship than
others.
(a) Describe how to use slips of paper to simulate the number of different
teams to win a championship in 19 seasons, assuming that each team is
equally likely to win the championship each season.
Write the name of each team on a slip of paper. Shuffle slips in a hat.
Select one team, record, and replace slip. Repeat for a total of 19
champions. Record number of different champions. Repeat many times.
Comments on student performance: Many students were able to describe how to
prepare the slips. Most of these correctly selected 19 slips with
replacement, although some left this out. However, many students did not
discuss what they would do after the 19 selections (e.g., record the number
of different champs).
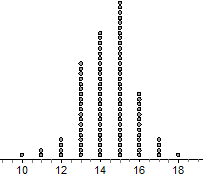
One hundred trials of a simulation were conducted, assuming that each team
is equally likely to win the championship each season. The number of
different teams to win a championship in 19 seasons was recorded for each
trial on graphed on the dotplot.
(b) There is one dot at 10. Explain what this dot represents.
Number of difference champions
In one simulated 19-year stretch, there were only 10 different champions.
Comments: Most students did well on this part.
(c) Based on the simulation and the data from the previous 19 seasons, is
there convincing evidence that some teams are more likely to win a
championship than others? Explain.
Because it is very unlikely to get 10 or fewer different winners by chance
alone (p-value 1/100), we reject H0. There is convincing evidence that some
teams are more likely to win a championship than others.
Comments: As expected, this was the hardest part for students. About
10-15% had no idea what to do or tried a traditional z or t test. About 50%
focused on the wrong part of the sampling distribution (e.g., said the
evidence was convincing because there were no dots at 19, said the evidence
was convincing because the distribution was centered at 14-15, which was
less than 19 or 30). The remaining students focused on the small
probability that there would be 10 or fewer different champions by chance
alone. Some even called this a p-value! A few argued that 10 different
winners did not provide convincing evidence of Ha because 10 could happen by
chance, even though it is would be fairly unusual.

19 Feb
19 Feb
8:29 p.m.
Thought I'd just report about an assignment I gave a couple weeks ago, prompted by a
Morning Edition segment on NPR:
Does the p-value affect the value of the research? Listen to this NPR segment:
http://www.npr.org/2015/01/28/382056490/studies-critical-of-bilingual-benef…
(Links to an external
site.)<http://www.npr.org/2015/01/28/382056490/studies-critical-of-bilin…
and write a few paragraphs (no more than one page) response/commentary.
As part of your response, either give some examples of kinds of studies where a high
p-value (so "negative results") might actually be useful public knowledge or
explain why only studies with low p values are worthy of publication. If you wish, you
could read the posted comments as a prompt for your thinking.
This was an extra credit opportunity, but (as I had hoped) it made the students who chose
to do it (about 2/3 of them) think carefully about what p-value means.
Jennifer
________________________________
From: sbi-bounces(a)causeweb.org [sbi-bounces(a)causeweb.org] on behalf of Josh Tabor
[joshtabor(a)hotmail.com]
Sent: Wednesday, February 18, 2015 4:06 PM
To: sbi(a)causeweb.org
Subject: [SBI] A sample item
Hello Everyone—
I wanted to share an item I included on my recent AP Statistics test. We had just
finished traditional one sample tests for a proportion and one sample tests for a mean. I
introduced the chapter with a simulation-based analysis of a test for a proportion, and we
had done several similar activities earlier in the year.
I like the item because it addresses the logic of inference, but doesn’t match up with one
of our traditional tests. Also, because it is about baseball!
I pasted it below and in the attachment. I also included a brief answer key and comments
on my student performance. Feel free to use it with your students if you are interested.
Thanks,
Josh Tabor
In a recent Sports Illustrated article, author Michael Rosenberg addresses “America’s Wait
Problem.” That is, he discusses how fans of some teams have to wait many, many years for
their team to win a championship. In Major League Baseball, fans should expect to wait an
average of 30 years for a championship—assuming all 30 teams are equally likely to win a
championship each season.
But is it reasonable to believe that all teams are equally likely to win a championship?
In the last 19 seasons, only 10 different teams won a championship. Does this provide
convincing evidence that some teams are more likely than others to win a championship? We
can find out by testing the following hypotheses:
H0: All 30 teams are equally likely to win a championship
Ha: Some teams are more likely to win a championship than others.
(a) Describe how to use slips of paper to simulate the number of different teams to win a
championship in 19 seasons, assuming that each team is equally likely to win the
championship each season.
Write the name of each team on a slip of paper. Shuffle slips in a hat. Select one team,
record, and replace slip. Repeat for a total of 19 champions. Record number of different
champions. Repeat many times.
Comments on student performance: Many students were able to describe how to prepare the
slips. Most of these correctly selected 19 slips with replacement, although some left
this out. However, many students did not discuss what they would do after the 19
selections (e.g., record the number of different champs).
One hundred trials of a simulation were conducted, assuming that each team is equally
likely to win the championship each season. The number of different teams to win a
championship in 19 seasons was recorded for each trial on graphed on the dotplot.
(b) There is one dot at 10. Explain what this dot represents.
[cid:image005.png@01D04B8C.6F08B290]
Number of difference champions
In one simulated 19-year stretch, there were only 10 different champions.
Comments: Most students did well on this part.
(c) Based on the simulation and the data from the previous 19 seasons, is there
convincing evidence that some teams are more likely to win a championship than others?
Explain.
Because it is very unlikely to get 10 or fewer different winners by chance alone (p-value
[cid:image006.png@01D04B8C.6F08B290] 1/100), we reject H0. There is convincing evidence
that some teams are more likely to win a championship than others.
Comments: As expected, this was the hardest part for students. About 10-15% had no idea
what to do or tried a traditional z or t test. About 50% focused on the wrong part of the
sampling distribution (e.g., said the evidence was convincing because there were no dots
at 19, said the evidence was convincing because the distribution was centered at 14-15,
which was less than 19 or 30). The remaining students focused on the small probability
that there would be 10 or fewer different champions by chance alone. Some even called
this a p-value! A few argued that 10 different winners did not provide convincing
evidence of Ha because 10 could happen by chance, even though it is would be fairly
unusual.
3362
days inactive
3364
days old
1 comments
2 participants
participants (2)
-
 Galovich, Jennifer
 -
 Josh Tabor